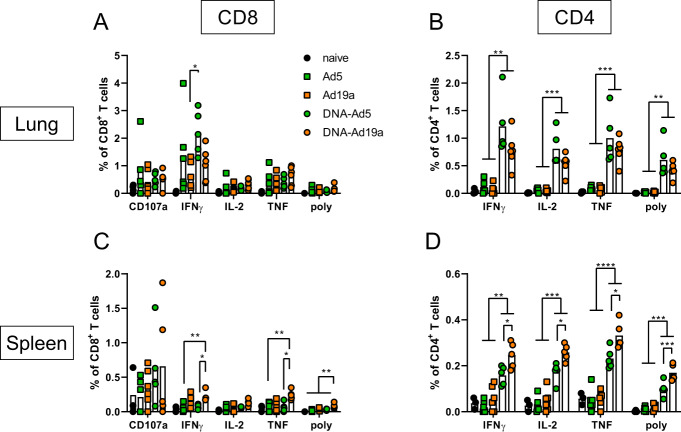
Fig. 4. Spike-specific T cell responses after intranasal immunization with Ad5- or Ad19a-based viral vector vaccines.
BALB/c mice were vaccinated according to Fig. 1A. Lung and spleen homogenates were restimulated with peptide pools covering major parts of S. The responding CD8+ (A and C) and CD4+ T cells (B and D) were identified by intracellular staining for accumulated cytokines or staining for CD107a as degranulation marker. The gating strategy is shown in Supplementary Fig. 3. Bars represent group means overlaid with individual data points; naïve n = 4 (exception: n = 3 in C and D); DNA-Ad5 n = 5; other groups n = 6. Data were analysed by one-way ANOVA followed by Tukey’s multiple comparison test. Statistically significant differences are indicated only among the different vaccine groups; p values indicate significant differences (*p < 0.05; **p < 0.005; ***p < 0.0005; ****p < 0.0001). poly; polyfunctional T cell population positive for all assessed markers.

