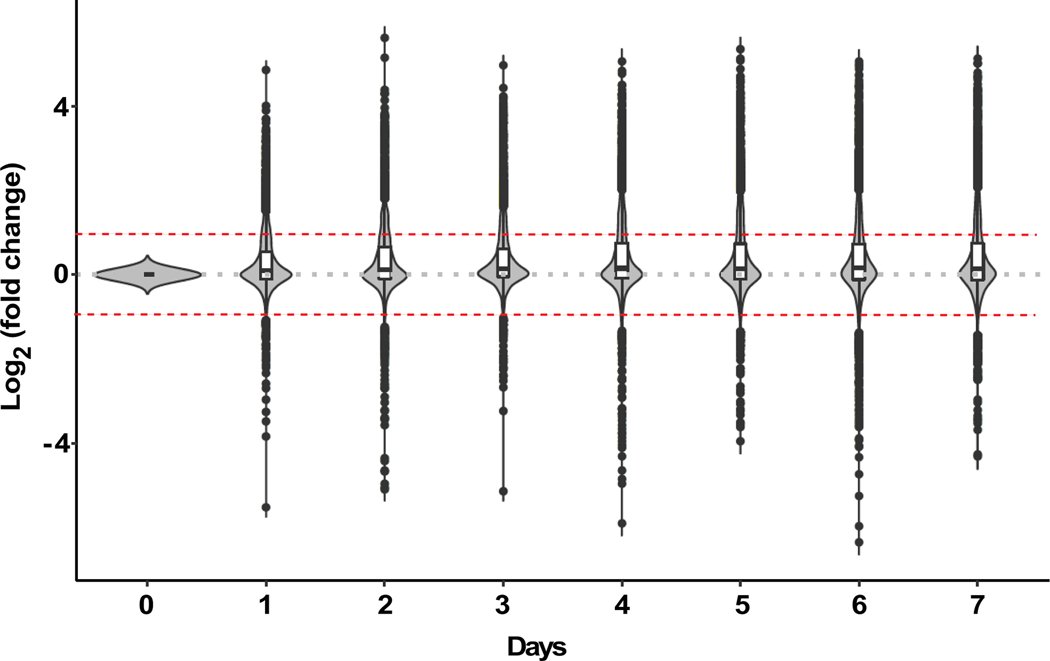
Figure 2. Stability of DBS metabolites.
Violin plots showing fold change (represented as log2 fold change) in measured signal intensity for metabolites from DBS stored at room temperature over 7 days. The width of each violin plot represents the number of metabolites present at the corresponding fold-change and therefore indicate that signal intensity for most of the measured metabolites (~80%) change less than 2-fold (represented by red dashed lines) over seven days of storage relative to Day 0. The first and third quartile of the log2 fold-change is represented by the lower and upper boundaries of the white bar in the center of the violin plots, respectively. The median log2 fold-change is represented by the black line in the white bar in the center of the violin plots.

