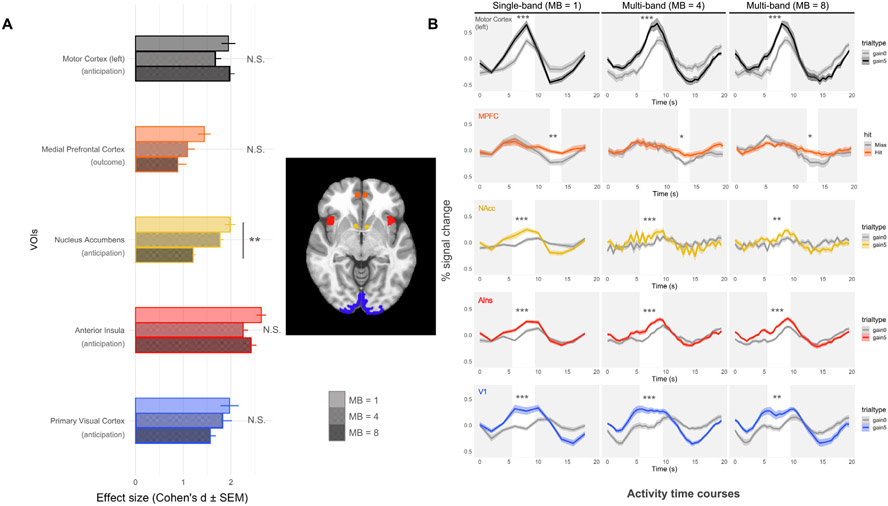
Fig. 3.
Effects and activity time courses for large gain (+$5.00) versus nongain (+$0.00) contrasts across VOIs. (A) Effect size estimates (Cohen’s d ± standard error) are calculated separately for large gain versus nongain anticipation or outcome (for MPFC) contrasts in each VOI. Significant differences are marked with * (* p<0.05; **p<0.01; ***p<0.001); (B) VOI activity time course data for single-band (MB1) versus multi-band (MB4 and MB8) data (n = 12; within-subjects). In all plots, time on the x-axis is seconds after trial onset (at second 0). White bars highlight time points of interest corresponding to either anticipation or outcome periods (after a 6 s lag for the hemodynamic delay).

