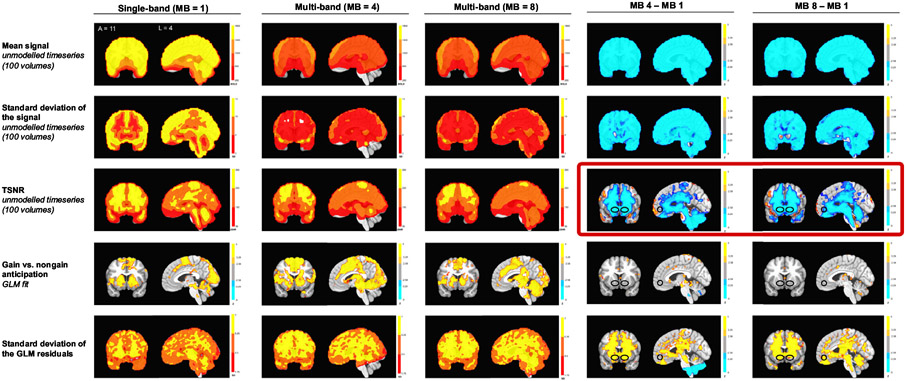
Fig. 4.
Whole brain signal and noise measures for baseline and modeled data from FMRI scans during the MID task. Rows depict: (1) mean overall activity; (2) standard deviation of overall activity; (3) temporal signal-to-noise ratio; (4) gain versus nongain anticipation coefficient (thresholded at p < 0.01 with a cluster size of 4); and (5) standard deviation of the gain versus nongain anticipation coefficient.

