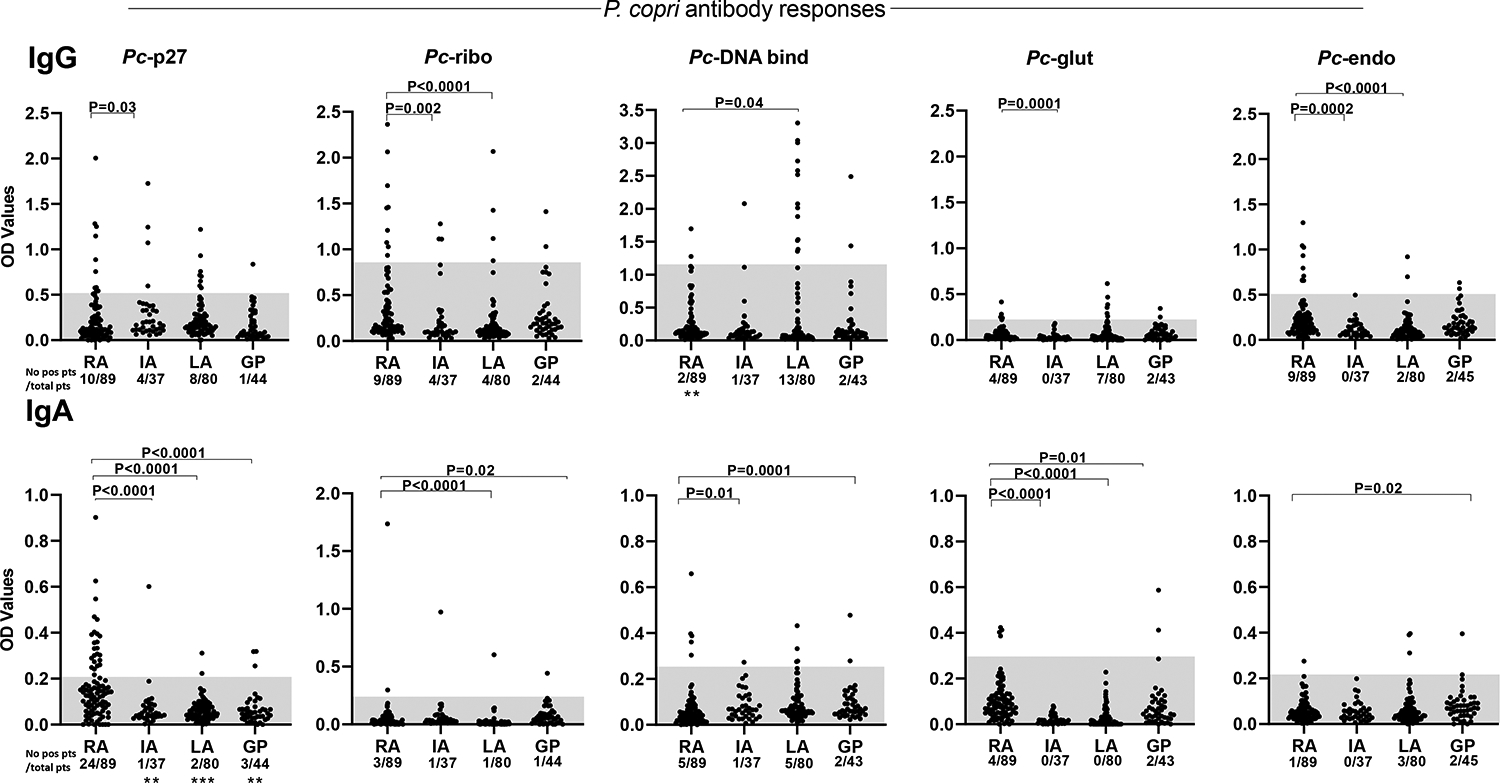
Figure 2. Antibody responses to P. copri proteins in RA patients, those with other forms of arthritis, and those in the general population.

IgG and IgA antibody responses to the 5 Pc proteins are shown. The shaded areas represent 2 SD above the mean value in the general population. Quantitative values were compared between RA patients and those in each of the other groups using Mann-Whitney test; the P values for these comparisons are shown above the data points. The number of individuals in each group with positive responses were compared between RA patients and those in each of the other groups by Fisher’s exact test; P values for these comparisons are shown at the bottom of each panel (**=0.001 and ***=0.0001). Only significant P values are shown. OD = optical density, RA = rheumatoid arthritis, IA = other chronic inflammatory arthritides, LA = Lyme arthritis, and GP = general population.
