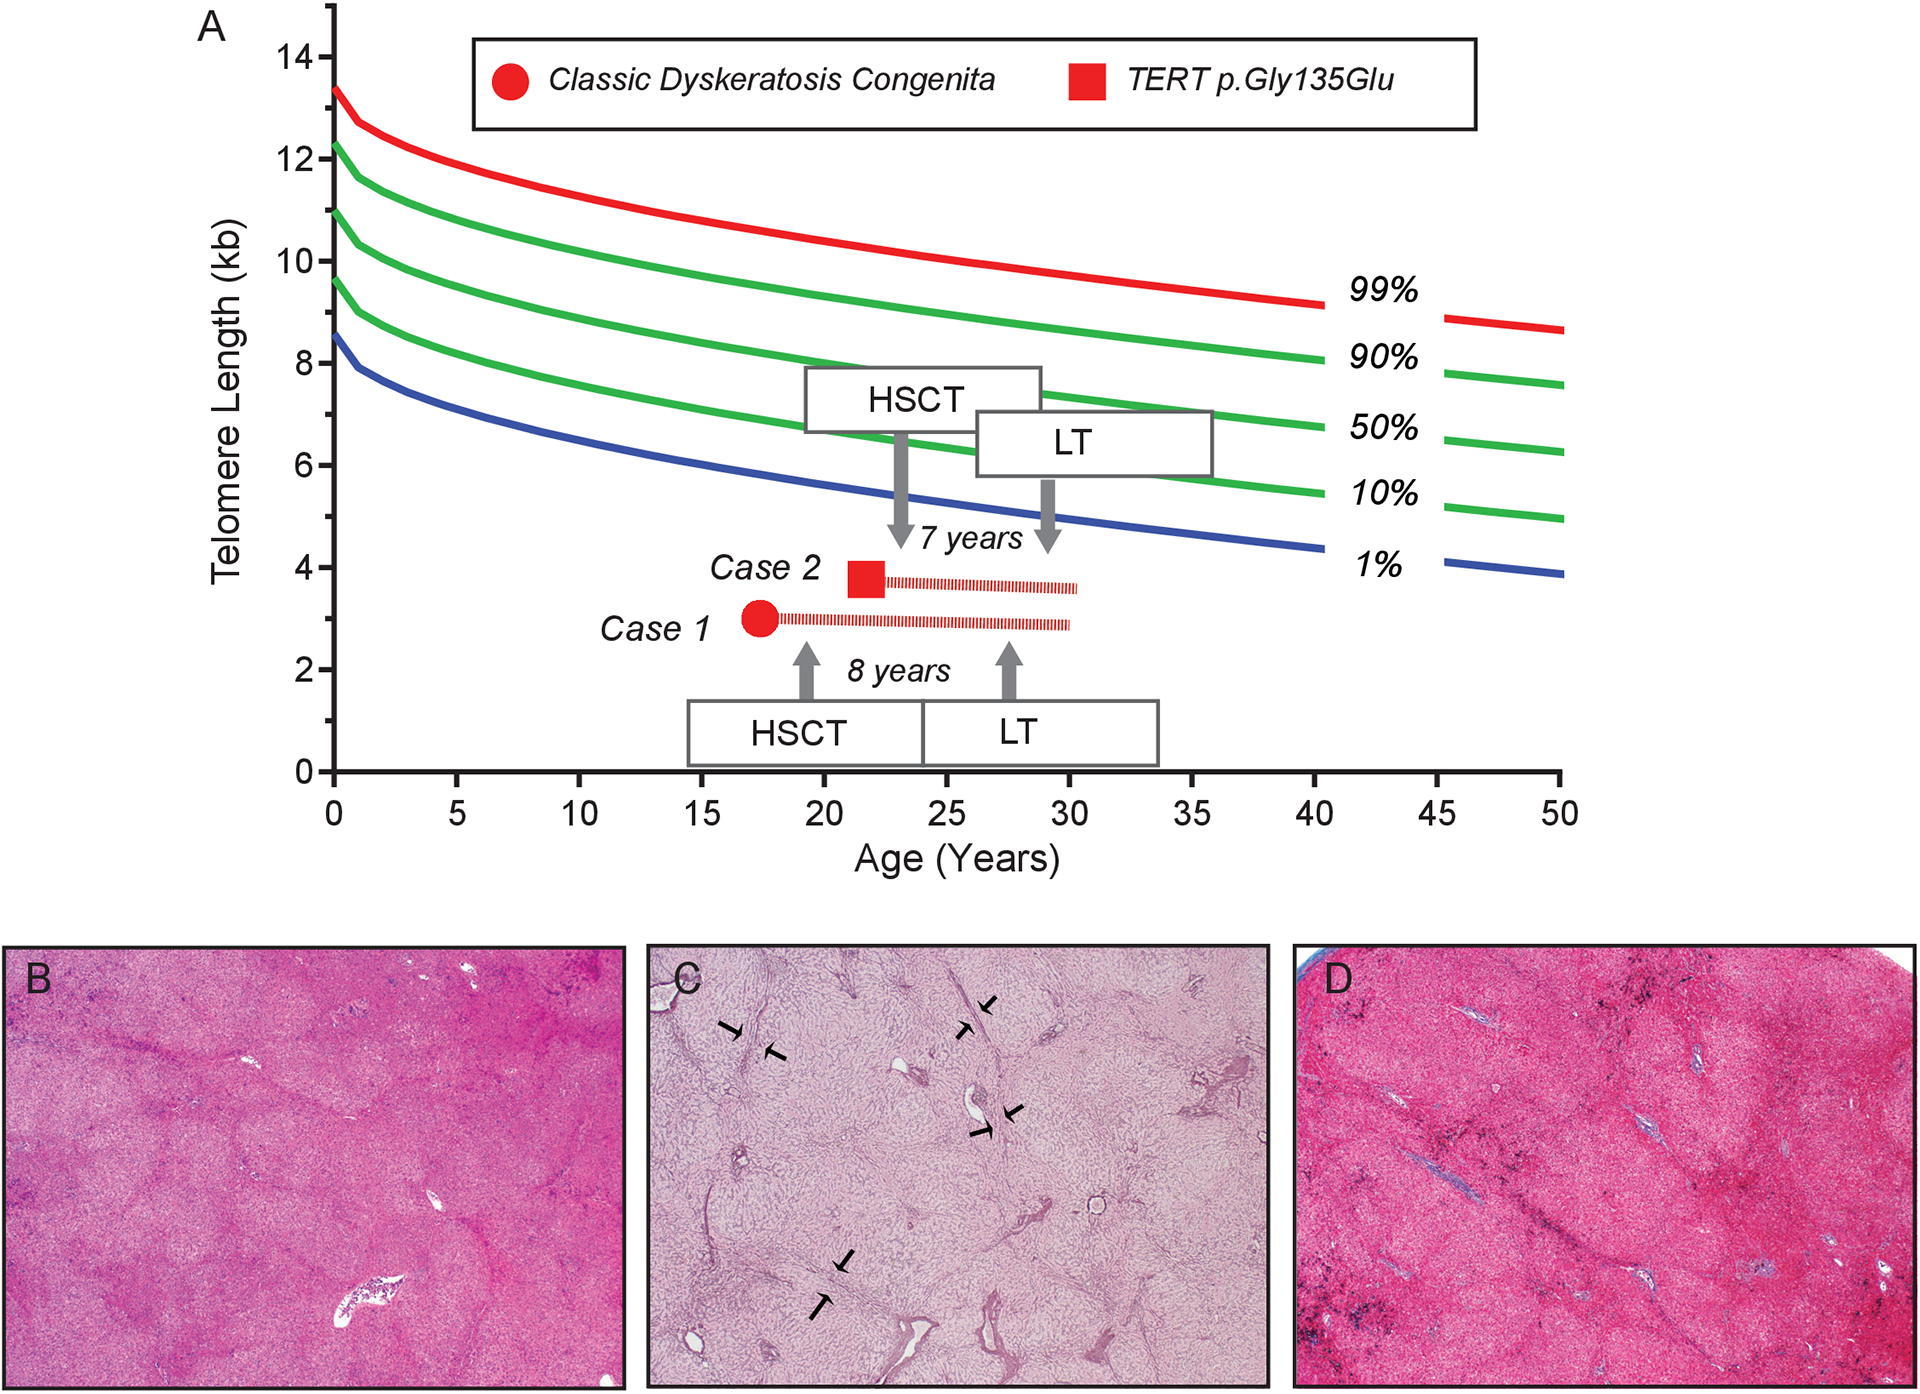
Figure 1. Telomere length, timeline of transplants relative to patient’s history and explant pathology.

A. Telogram shows lymphocyte telomere length from patients 1 and 2 as measured by flow cytometry and fluorescence in situ hybridization (flowFISH). In both patients, it falls below the first age-adjusted percentile at diagnosis. The granulocyte telomere length, which is not shown, was also concordant falling in a similar respective range. The timeline shown schematizes the timing of hematopoietic stem cell transplantation (HSCT) relative to liver transplantation (LT) with the number of years intervening and the followup. B. Representative liver explant hematoxylyn and eosin stained section demonstrating nodularity in the hepatic parenchyma (x20). C. Reticulin stain highlights compression of hepatocytes at the edges of nodules (arrows) (x20). D. Masson trichrome stain reveals no significant fibrosis (x20).
