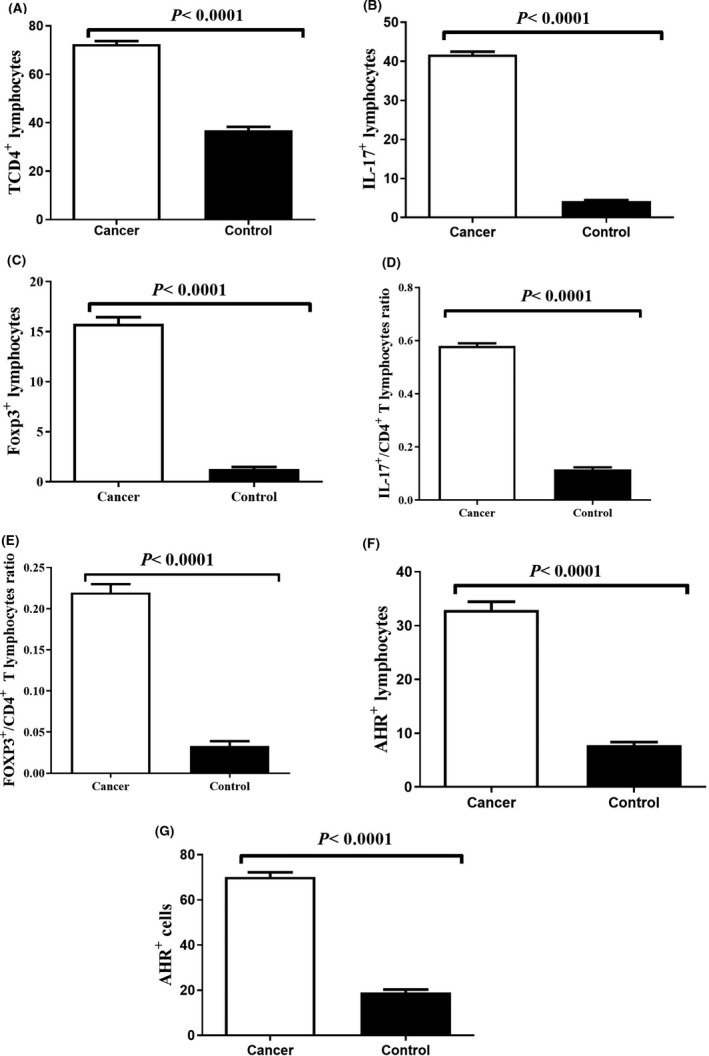
FIGURE 2.

Frequency of (A) T CD4+ lymphocytes, (B) IL‐17+ lymphocytes, (C) Foxp3+ lymphocytes, (D) ratio of IL‐17+/CD4+ T lymphocytes, (E) ratio of Foxp3+/CD4+ T lymphocytes, (F) AHR+ lymphocytes, and (G) AHR+ cells in tumour tissues in comparison with non‐tumoural tissue. P‐value < 0.05 was considered statistically significant using t test
