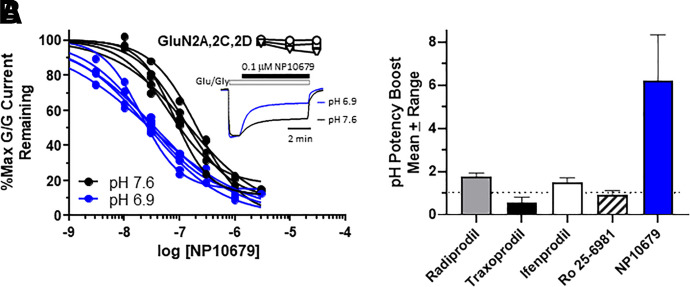
Fig. 1.
Pharmacology of NP10679 at NMDA receptors in oocytes. (A) NP10679 concentration-response curves for inhibition of GluN2B NMDA receptors expressed in Xenopus oocytes at pH 6.9 (blue symbols) and pH 7.6 (black symbols). Each fitted line and associated symbols represent the result from one experiment (i.e., frog injection, five total). The symbols are means from 12–22 oocytes from each experiment. The NP10679 effect on GluN2A (circles), GluN2C (squares), and GluN2D (triangles) NMDA receptors is shown at the indicated concentrations; mean ± S.E.M., n = 4 for GluN2A, 2C, and 2D results. The inset shows a representative current trace for NP10679 inhibition of GluN2B receptors at 0.1 μM at the two indicated pH values. Max G/G is the receptor current obtained in 100 μM glutamate and 30 μM glycine. (B) The pH potency boost for NP10679 (blue bar, n = 5 experiments) is compared with the pH boost for known preclinical and clinical GluN2B-selective inhibitors (n = 3 experiments each). The pH Boost is the ratio of IC50 at pH 7.6/IC50 at pH 6.9.

