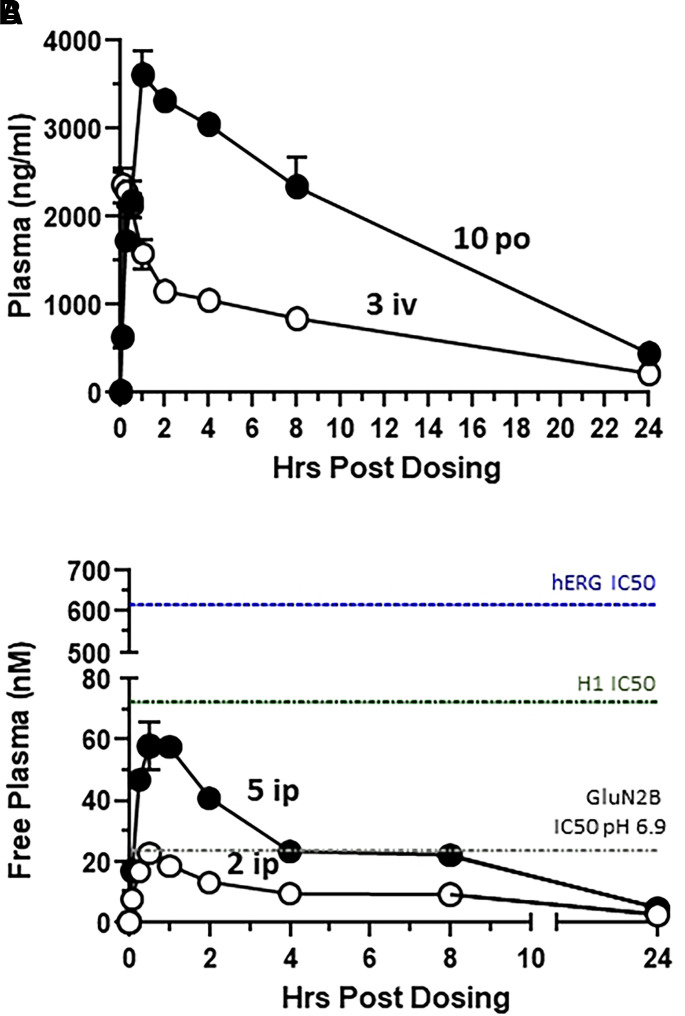
Fig. 3.
Pharmacokinetics of NP10679 in mouse. (A) Total plasma levels of NP10679 after a 10 mg/kg oral dose (black symbols) and a 3 mg/kg i.v. dose (open symbols) in mice are plotted. (B) Free plasma levels of NP10679 after a 2 mg/kg (open symbols) and a 5 mg/kg i.p. (black symbols) dose in mice are given. For (A) and (B), data are means ± S.E.M. (n = 3 per data point). The gray dashed line indicates the IC50 of NP10679 for pH 6.9 inhibition of GluN2B receptors, the green dashed line is the functional IC50 at H1 histamine receptors, and the blue dashed line is the functional IC50 at hERG potassium channels.

