Fig. 3.
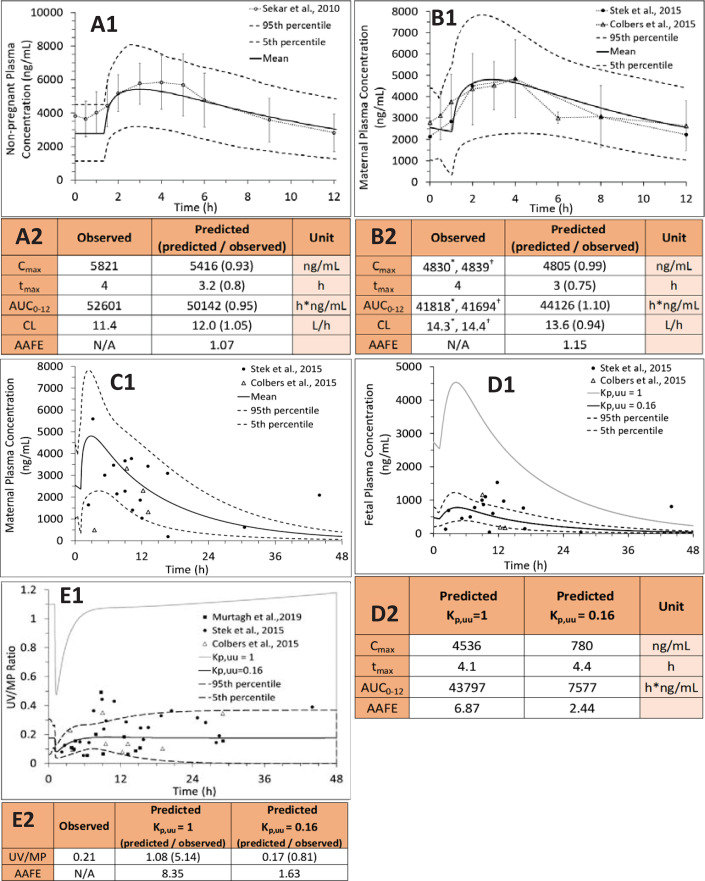
PBPK predictions of DRV steady-state plasma concentrations in (A1) nonpregnant individuals, (B1) pregnant women at GW34 (intensively sampled), (C1) pregnant women at GW38 (sparsely sampled) and their (D1) fetuses at GW38 (sparsely sampled), and (E1) UV/(MP ratio at GW38 with and without incorporation of placental P-gp efflux. Subjects were administered DRV/RTV 600/100 mg oral twice daily. (A1) SimCYP or (B1 and C1) m-f PBPK predicted mean concentration-time profile (solid line) and CI90% (dashed lines) are overlaid on the observed data [intensively sampled (A1) circles: mean ± S.D., n = 8; (B1) circles: mean ± S.D., n = 32, triangles: mean ± S.D., n = 6; or (C1) sparsely sampled]. (D1 and D2) The observed fetal UV concentration-time data were better predicted by our m-f PBPK model in the presence of P-gp efflux clearance (Kp,uu = 0.16, black solid line; dashed lines, 5th and 95th percentile profiles) vs. in the absence of P-gp efflux clearance (i.e., passive diffusion only resulting in Kp,uu = 1, gray solid line). (E1) The m-f PBPK model better predicted UV/MP ratios in the presence of P-gp efflux clearance (Kp,uu = 0.16) vs. in the absence of P-gp efflux clearance (Kp,uu = 1). The observed UV/MP ratios are combined from two dosing regimens of DRV/RTV: 600/100 twice daily and 800/100 every day to increase the confidence in our model verification as these ratios are independent of dosing regimen. (A2, B2, D2 and E2) The predicted pharmacokinetic parameters in (A2) and (B2) met our a priori defined acceptance criteria (within 0.8- to 1.25-fold of the observed data). The observed PK parameters were estimated from Stek et al. (2015)* or Colbers et al. (2015)†.

