Fig. 1.
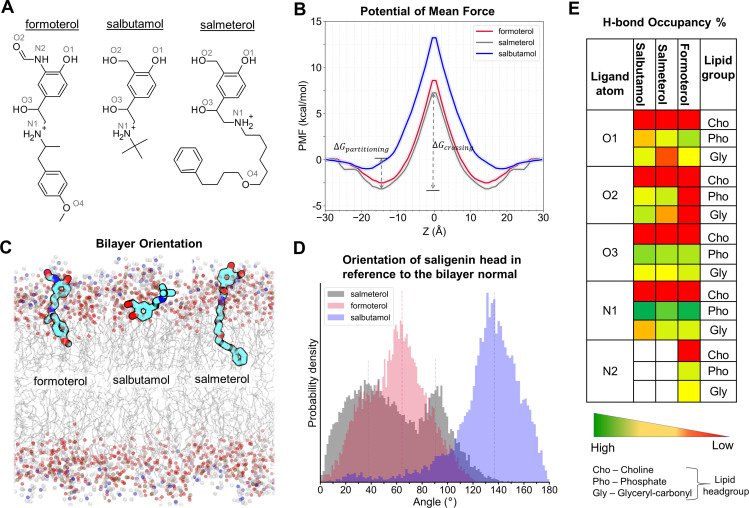
Membrane partitioning characteristics of salmeterol, formoterol, and salbutamol in the bilayer, made up of POPC and cholesterol. (A) Two-dimensional structures of the studied β2-AR agonists. (B) The PMF curves show the solvation free energies for membrane partitioning and crossing of the ligands, revealing their energetically favorable bilayer locations (of their COMs). Both salmeterol and formoterol show similar free energy profiles, whereas salbutamol has higher energy barriers for partitioning and crossing of the membrane. (C) The time-average preferred orientations of the ligands within the membrane. The nitrogen atom of the choline, phosphorous atom of the phosphate, and oxygen of the glyceryl carbonyl headgroups are represented as balls in blue, olive green, and red colors, respectively. The lipid alkyl chains are represented as lines in gray color. (D) The distinct bilayer orientation of the saligenin head in each ligand is quantified as a tilt angle between the bilayer normal (z-axis) and a vector, connecting O1 and N1 atoms of the ligands. The vertical dashed lines represent the mean values. (E) The percentage (%) H-bond occupancy of the polar atoms of each ligand with lipid headgroups (choline, phosphate, and glyceryl carbonyls) through the simulation time. H-bonds are counted only if the bond distance and angle are within the cutoff values of 3.5 Å and 40 degrees, respectively.

