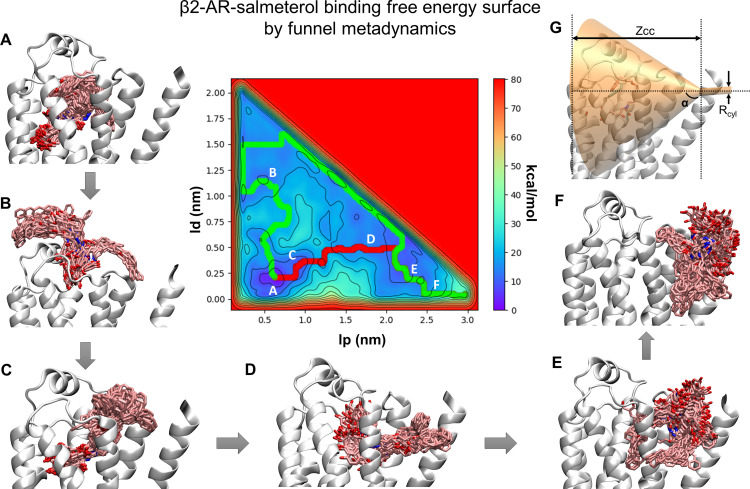
Fig. 10.
The free energy surface of salmeterol binding to β2-AR obtained from the funnel metadynamics simulation using lp, the position of the ligand along the funnel axis, and ld, the distance of the ligand from this axis, as collective variables. Two minimum energy paths, one passing through the aqueous bulk (green) and another through the transmembrane helices (red), reaching the membrane, were determined by the Minimum Energy Path Surface Analysis tool. (A–F) Multiple clusters representing the fully bound state (A) to several intermediate conformational states (B–F) were sampled by several recrossing between bound and unbound states during the entire 900-ns simulation. (G) The funnel placement was based on several association/dissociation simulations during which salmeterol was seen leaving the pocket either by aqueous routes or by a transmembrane route through TMH 1 and 7. The cone region of the funnel was defined by a vertex height Zcc of 3.0 nm from the origin and an α angle of 0.6 rad. The radius of the cylindrical portion of the funnel rcyl was 2 Å.

