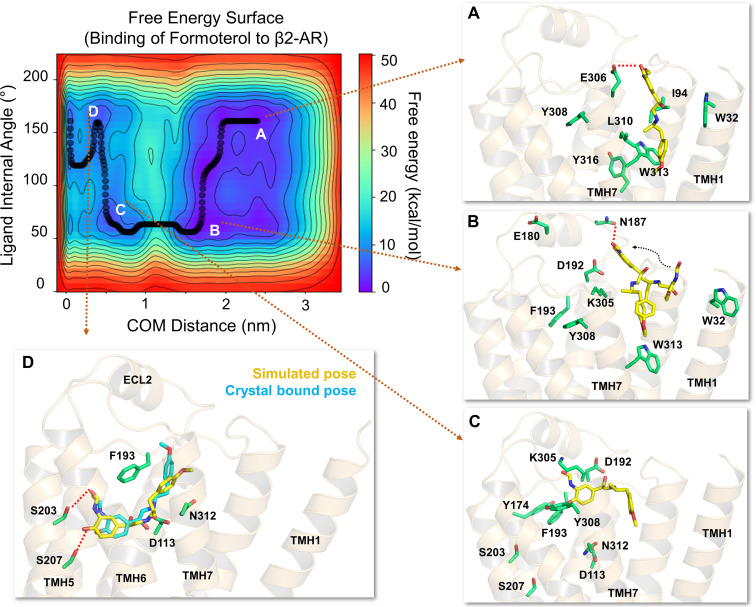
Fig. 4.
The free energy surface for formoterol’s access and binding to the β2-adrenergic receptor from its energetically favorable location in the membrane. The two-dimensional free energy surface is characterized by the distance between the COM of the ligand and binding site residues (x-axis) and the internal angle of formoterol (y-axis). The minimum energy path, as determined by well tempered metadynamics simulations, is given in bold black line, and several representative low-energy intermediate states along the path were labeled (A–D). (A) As formoterol (licorice representation, yellow color) approaches the receptor from within the membrane, its alkoxy-aryl-alkyl tail comes into contact with TMHs 2 and 7, engaging in hydrophobic contacts with I942.65, L3107.37, and W3137.40. (B and C) Formoterol moves up over the transmembrane helices and remains in a region where it makes extensive H-bond interactions with several polar residues and bulk water molecules. Specifically, the H-bond with D192ECL2 through its O3 appears to destabilize the salt bridge between D192ECL2 and K3057.32. The breakage of the salt bridge allows formoterol to slide down from this region into the binding pocket. As formoterol enters the pocket, the hydrophobic lock (between F193ECL2 and Y3087.35) breaks, resulting in the formation of a π-π interaction between F193’s phenyl ring and the aromatic ring at the tail end of the ligand. (D) Formoterol is seen in its final bound pose, slightly different from its X-ray structure pose (RMSD 2.1Å) bound to turkey β1-AR [PDB ID 6IBL (Lee et al., 2020)]. In its final bound pose, formoterol engages in polar H-bond and salt bridge interactions with S2035.42, S2075.46, D1133.32, and N3127.39. Formoterol (crystal pose in cyan) and the binding site residues (green) are illustrated in licorice representation. The receptor is illustrated in secondary structure representation (light golden yellow).

