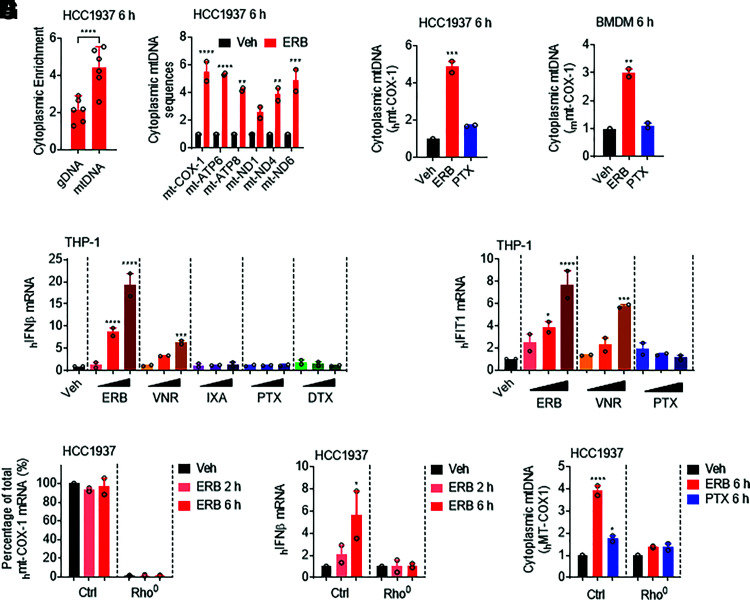
Fig. 5.
Eribulin promotes cytoplasmic accumulation of mtDNA. (A) qRT-PCR analysis of relative abundance of genomic DNA (gDNA) (ACTb, GAPDH, HPRT, PGK, RPS18, and TBP) and mitochondrial DNA (mtDNA) (ATP6, ATP8, COX-1, ND1, ND4, and ND6) sequences present in the cytoplasm of HCC1937 cells treated with 100 nM eribulin (ERB) for 6 hours. Data are shown as the ratio of gDNA or mtDNA in the cytoplasmic fraction as compared with the organelle-enriched fraction and normalized to the vehicle control as fold change. Significance was determined by one-way ANOVA with Dunnett’s post hoc test. (B and C) COX-1 mtDNA present in the cytoplasm of HCC1937 (B) or BMDM (C) cells treated with 100 nM eribulin or paclitaxel (PTX) for 6 hours as compared with vehicle. Significance determined by vehicle-compared one-way ANOVA with Dunnett’s post hoc test compared with vehicle. (D) IFNβ mRNA in THP-1 cells treated with 10, 100, or 1000 nM ERB, vinorelbine (VNR), ixabepilone (IXA), PTX, or docetaxel (DTX) for 24 hours. Significance determined by vehicle-compared two-way ANOVA (drug * concentration) with Tukey’s post hoc test compared with vehicle. (E) IFIT1 mRNA in THP-1 cells treated with 10, 100, or 1000 nM ERB, VNR, or PTX for 24 hours. Significance determined by vehicle-compared two-way ANOVA (drug * concentration) with Tukey’s post hoc test compared with vehicle. (F) COX-1 mRNA in control and ethidium bromide cultured (Rho0) HCC1937 cells treated with 100 nM eribulin for 2 or 6 hours as compared with DMSO. Significance was determined by two-way ANOVA (Rho status * drug) with Tukey’s post hoc test. (G) IFNβ mRNA in control and Rho0 HCC1937 cells treated with 100 nM eribulin for 2 or 6 hours as compared with DMSO. Significance was determined by two-way ANOVA (Rho status * drug) with Tukey’s post hoc test. (H) Cytoplasmic COX-1 DNA present in control and Rho0 HCC1937 cells treated with 100 nM eribulin or paclitaxel for 6 hours as compared with DMSO. Significance was determined by two-way ANOVA (Rho status * drug) with Tukey’s post hoc test. Data are shown as individual points from two independent biologic replicates with error bars denoting range. *P < 0.05, **P < 0.01, ***P < 0.001, ****P < 0.0001. Veh, vehicle; ctrl, control.

