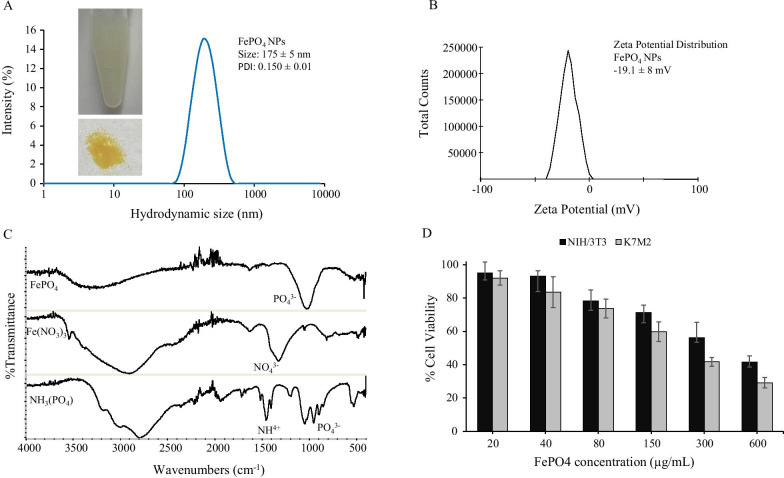
Fig. 1.
Characterization and biocompatibility of FePO4 nanoparticles. a Hydrodynamic size distribution of FePO4 NPs, b zeta potential measurement of FePO4 NPs showing the surface charge, c FTIR of FePO4 NPs and its precursor-Fe(NO3)3 and (NH4)3PO4, and d biocompatibility of FePO4 NPs on mouse osteosarcoma K7M2 and mouse fibroblast NIH/3T3 cell line. NPs were treated at various concentrations for 48 h (a, b data represents mean ± s.d.; n = 3 replicates. d represents mean ± s.d., n = 6 replicates).

