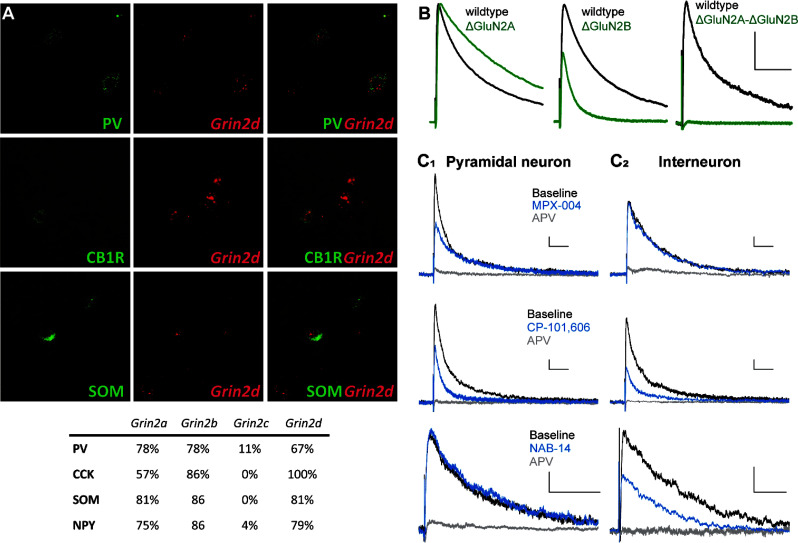
Fig. 31.
NMDA receptor expression in hippocampal CA1 neurons. (A) Upper panel: fluorescence in situ hybridization for CB1 cannabinoid receptor, parvalbumnin, and Grin2d mRNA. Lower panel: the percentage of CA1 interneurons showing the GluN2 subunit expression based on interneuron classification as determined by single-cell reverse transcription PCR (RT-PCR). PV, parvalbumin; CCK, cholecystokinin; SOM, somatostatin; NPY, neuropeptide Y. Adapted with permission from Perszyk et al. (2016). (B) Paired recordings of outward NMDA receptor–mediated evoked EPSCs (VHOLD +40 mV) from wild-type CA1 pyramidal neurons (black) and pyramidal neurons lacking GluN2A, GluN2B, or both subunits (green). Scale bars as are 25 pA and 100 milliseconds. Adapted with permission from Gray et al. (2011). (C) Whole-cell current recording of evoked EPSCs from either CA1 pyramidal cells (C1) or interneurons (C2) in the absence (black) or presence (blue) of the GluN2A-selective negative allosteric modulator MPX-004, the GluN2B-selective negative allosteric modulator CP-101,606, or the GluN2C/D-selective negative allosteric modulator NAB-14. These data demonstrate pyramidal cell expression of GluN2A/B and interneuron expression of GluN2B/2D. Scale bars are 20 pA and 100 milliseconds. Adapted with permission from Yi et al. (2019) and Swanger et al. (2018) (Copyright 2018 American Chemical Society).

