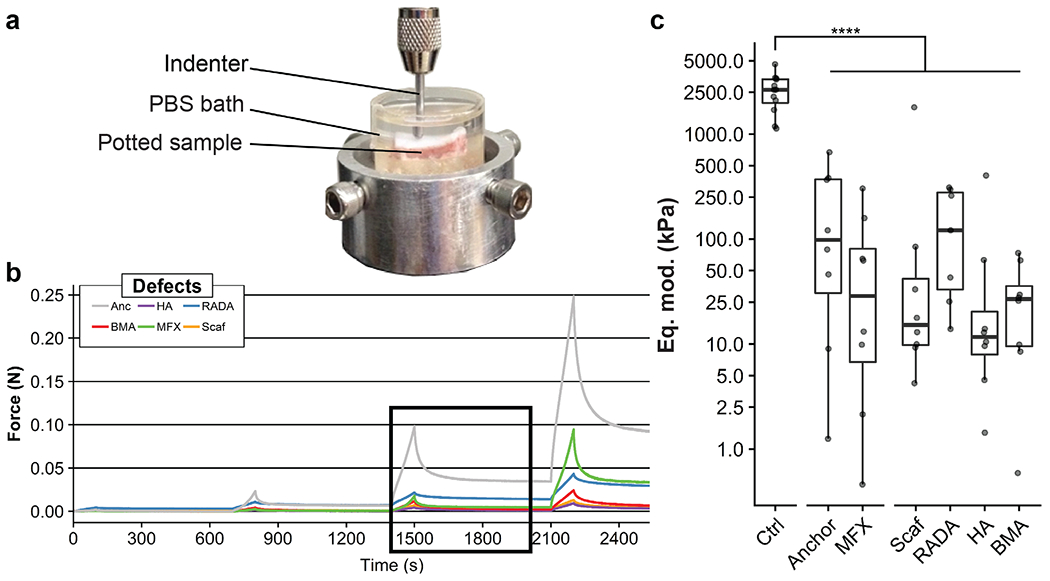
Fig. 3. Mechanical properties of regenerative tissue.

(a) Testing platform for cartilage indentation testing. (b) Representative force vs. time curves for defect samples. Box indicates third step of stress relaxation test. (c) Estimated equilibrium moduli (Eq. mod.) (displayed on a log10 scale) were calculated from the 3rd step of each curve. All treatment groups had a significantly (p < 0.0001) lower equilibrium modulus compared with healthy cartilage control. Plot shows median and interquartile range.
