
Fig. 4. Mechanical properties of native cartilage controls.
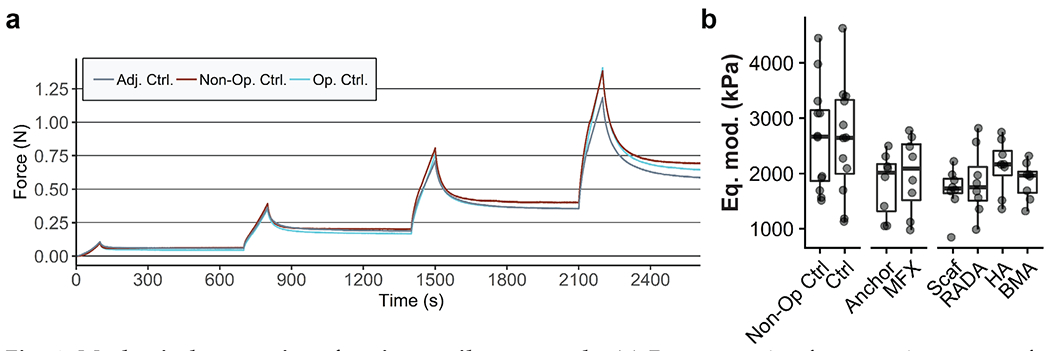
(a) Representative force vs. time curves for indentation tests of cartilage adjacent to experimental defects (within 2 mm), proximal to the defects within the operative joint, and from the femoral trochlea of the non-operative limb. (b) No differences in equilibrium moduli (Eq. mod.) were observed between the various controls. Plot shows median and interquartile range.