
Fig. 5. μCT analysis.
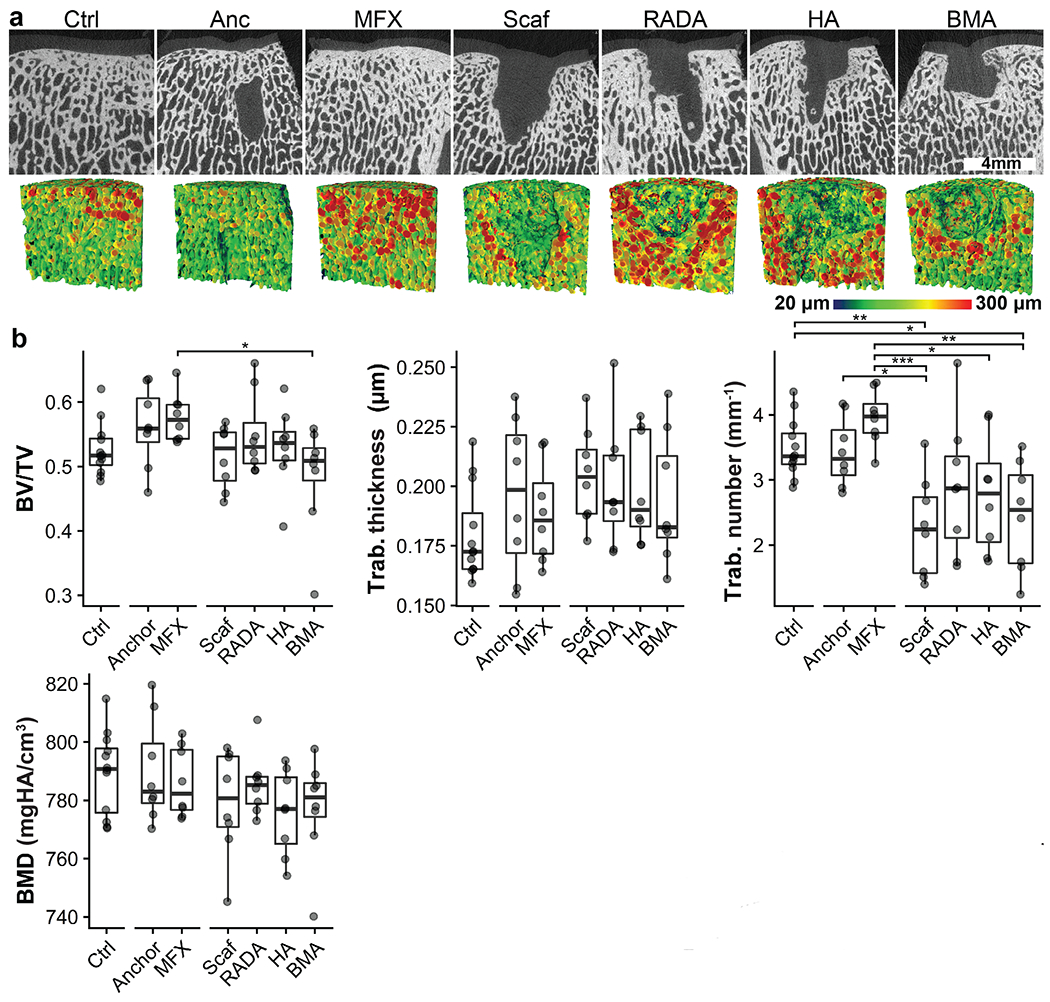
(a) Top row: mid-plane slice from a representative sample in each group. Bottom row: mid-plane of renderings of a 6 mm diameter × 5 mm deep volume of interest used to analyse bone morphometry. Heatmap shows trabecular (Trab.) thickness. (b) Results of quantitative bone morphometrical analysis. *p < .05, **p < .01, ***p < .001. Plots show median and interquartile range.