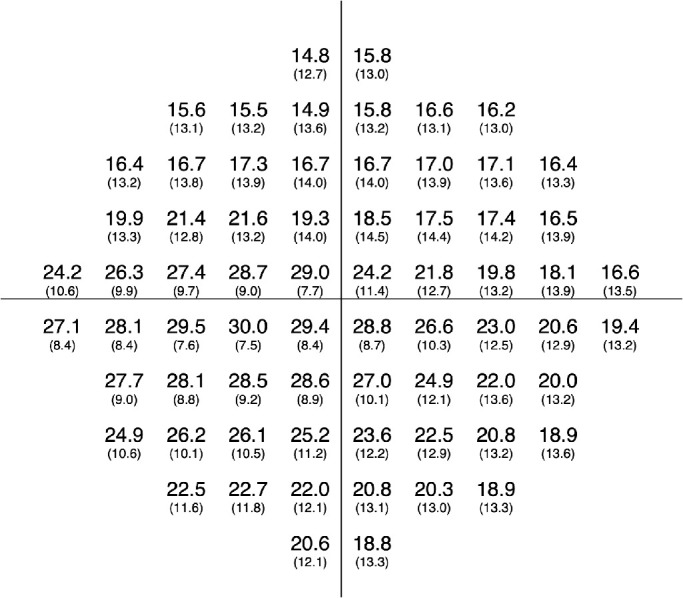
Figure 2.

Actual threshold values of the 10-2 VF test (left eye). Mean (upper row) and standard deviation (lower row) values of all eyes at each test point are shown. Right eyes were mirror imaged.

Actual threshold values of the 10-2 VF test (left eye). Mean (upper row) and standard deviation (lower row) values of all eyes at each test point are shown. Right eyes were mirror imaged.