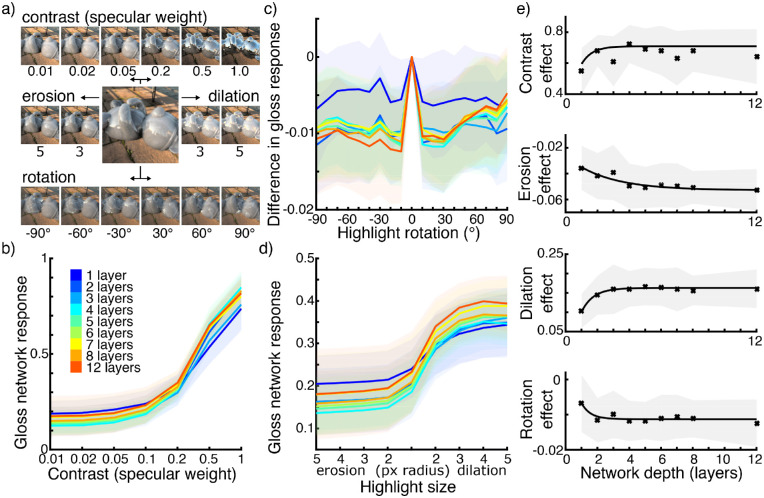
Figure 3.
(a) Examples of gloss manipulations. The larger central image shows an image with unmanipulated specular component and a specular weight of 0.1. The top row shows manipulations of contrast by changing the specular weight. The middle row shows manipulations of the size of highlights by erosion and dilation. The bottom row shows examples of images with rotated specular components. (b) Mean responses of networks of different depths to images with different gloss contrasts (specular weights). Shaded areas show standard deviations. (c) Mean response differences for networks of different depths to images with rotated highlights. Note that the y-axis shows mean response differences rather than absolute responses, because network responses for each image are compared to a parallel image with specular components that are not rotated from the original but corrected for coverage according to the overlap in rotated images (see Methods for details). Shaded areas show standard deviations. (d) Mean responses of networks of different depths to images with differently sized highlights (through erosion and dilation). Shaded areas show standard deviations. (e) Mean effect sizes of gloss contrast, erosion, dilation, and rotation for networks of different depths. Shaded areas show standard deviations per network depth.

