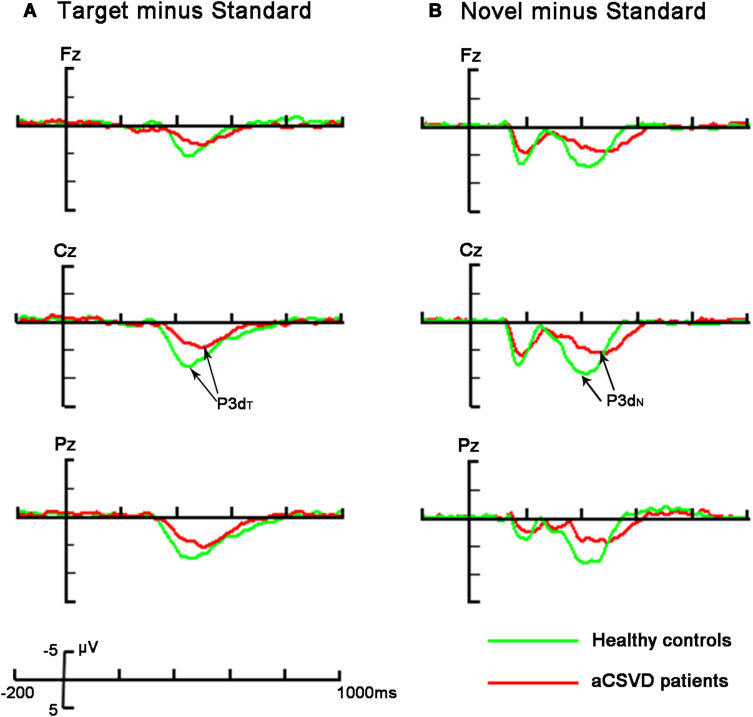
Figure 5.
The above description and analysis were the averaged difference waveforms between the two groups (red line represents aCSVD patients and green line represents healthy controls). The electrode position: Fz, Cz, Pz. (A) Target minus standard difference ERPs (P3dT); (B) novel minus standard difference ERPs (P3dN).

