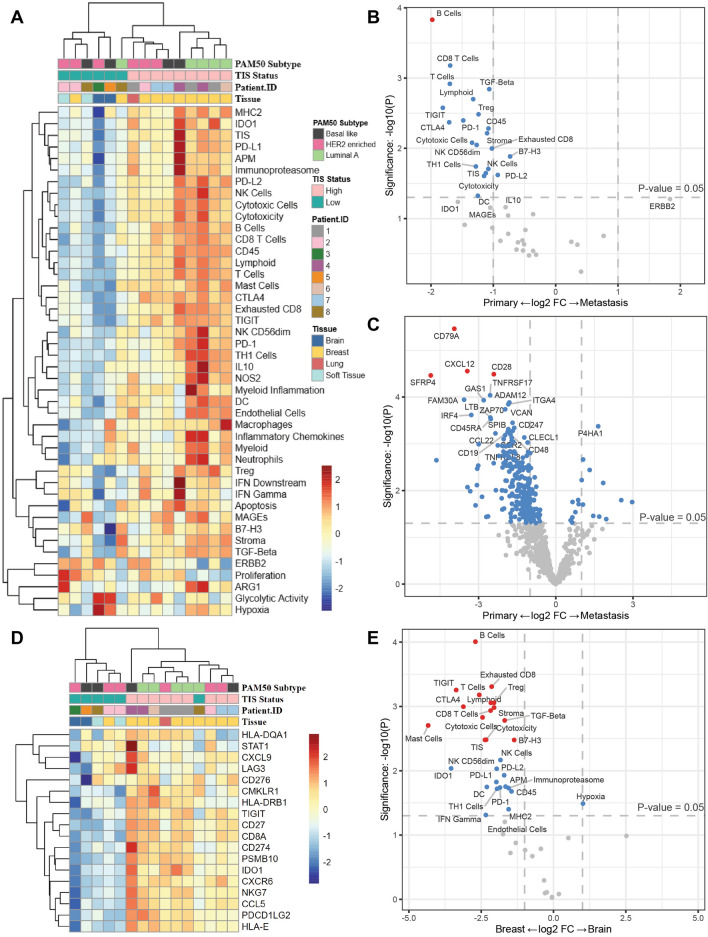
Fig. 1.
IO360 gene expression analysis of primary and metastatic lesions. A Unsupervised hierarchical clustering of IO360 signatures for each sample. B Differential expression of IO360 signatures comparing primary breast and metastatic samples. C Differential expression of IO360 genes comparing primary breast and metastatic samples. D Unsupervised hierarchical clustering of the 18 TIS genes. E Differential expression of IO360 genes comparing primary breast and brain metastases. For B,C,E vertical dotted lines represent a onefold log change and the horizontal line marks an unadjusted p-value of p < 0.05. Dots in grey are not significant, dots in blue have an unadjusted p-value of < 0.05 and dots in red have an unadjusted p-value of < 0.05

