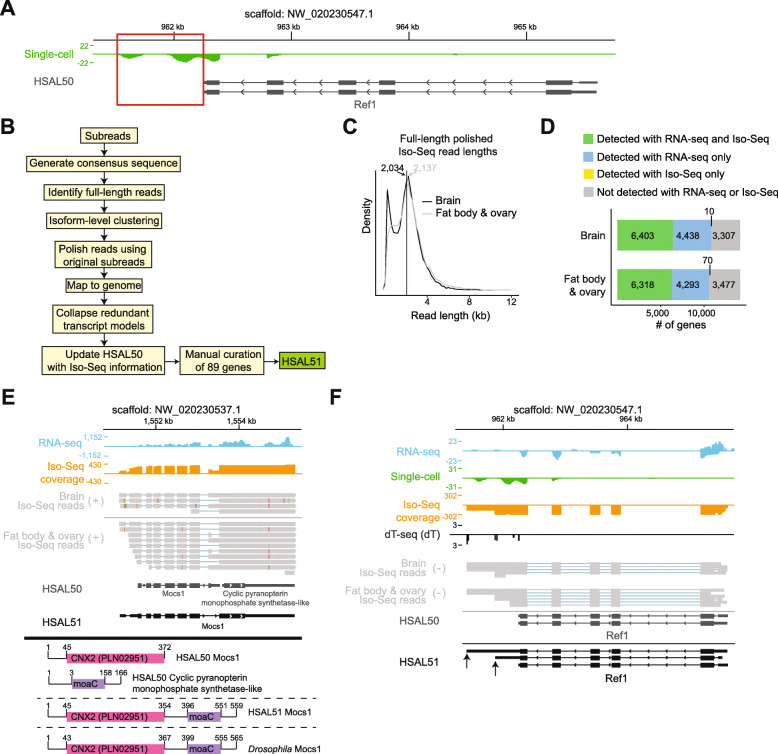
Fig. 1.
Iso-Seq improves gene models in Harpegnathos. A A gene with an incomplete 3′ UTR in the current annotation that precludes accurate quantification of single-cell RNA-seq signal. Pooled single-cell RNA-seq from worker (n = 6) and gamergate (n = 5) brains [22] is shown. Scale represents counts per million. Red box indicates reads not assigned to the gene model. B Pipeline used for genome annotation. Iso-Seq reads from brains and fat body/ovary were processed and collapsed. The resulting Iso-Seq-based annotation was combined with the existing HSAL50 to produce an updated annotation, HSAL51. C Size distribution of polished, full-length Iso-Seq reads in brain and fat body/ovary. Vertical lines indicate median. D Number of genes detected in each Iso-Seq sample compared to short-read RNA-seq. E Example of a HSAL51 gene model derived from merging two incorrectly separated gene models in HSAL50. Coverage from short-read RNA-seq (blue) and Iso-Seq (orange) is shown in counts per million. Individual Iso-Seq reads from are also shown (gray). Below, the conserved domains on each relevant HSAL50 and HSAL51 gene are shown along with the conserved domains on Drosophila Mocs1. A subset of the HSAL51 Mocs1 isoforms are shown. F Same locus as in A, now including the updated HSAL51 annotation for Ref1, and showing RNA-seq and Iso-Seq coverage along with dT-seq and raw Iso-Seq reads. Scales represent counts per million. A subset of HSAL51 isoforms is shown and newly annotated TTSs are indicated by arrows

