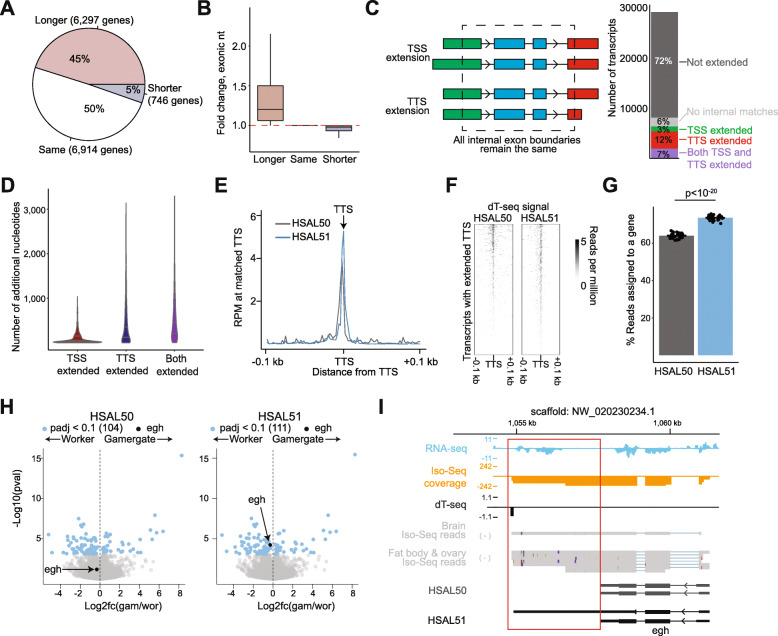
Fig. 3.
Extensions at 5′ and 3′ ends of genes improve analysis. A Number of genes whose exons cover the same, more, or fewer base pairs in HSAL51. B Fold-change in nucleotides covered by exons for each category in A. C Scheme depicting TSS or TTS extension (left) and the percent of genes with no change, no match (no transcript with the same internal exon boundaries), TSS extension, TTS extension, or both TSS and TTS extension (right). D Average number of nucleotides added to transcripts with TSS and/or TTS extension. E,F Metaplot (E) and heatmap (F) of dT-seq coverage in a 0.2-kb window around TTSs of transcripts with TTS extended by at least 200 nucleotides. G Percent of RNA-seq reads from worker brains mapping to features in HSAL50 or HSAL51. P value is from a paired Student’s t test. H Volcano plots of differential expression between gamergate (n = 12) and worker (n = 11) for HSAL50 (left) and HSAL51 (right). Genes with a padj < 0.1 are highlighted in blue. An example of a gene that is identified as differentially expressed in HSAL51 but not HSAL50 (egh) is highlighted in black. I Genome browser view of egh shows RNA-seq reads aligned to the extended portion of egh, which is supported by Iso-Seq reads. A subset of HSAL51 isoforms is shown

