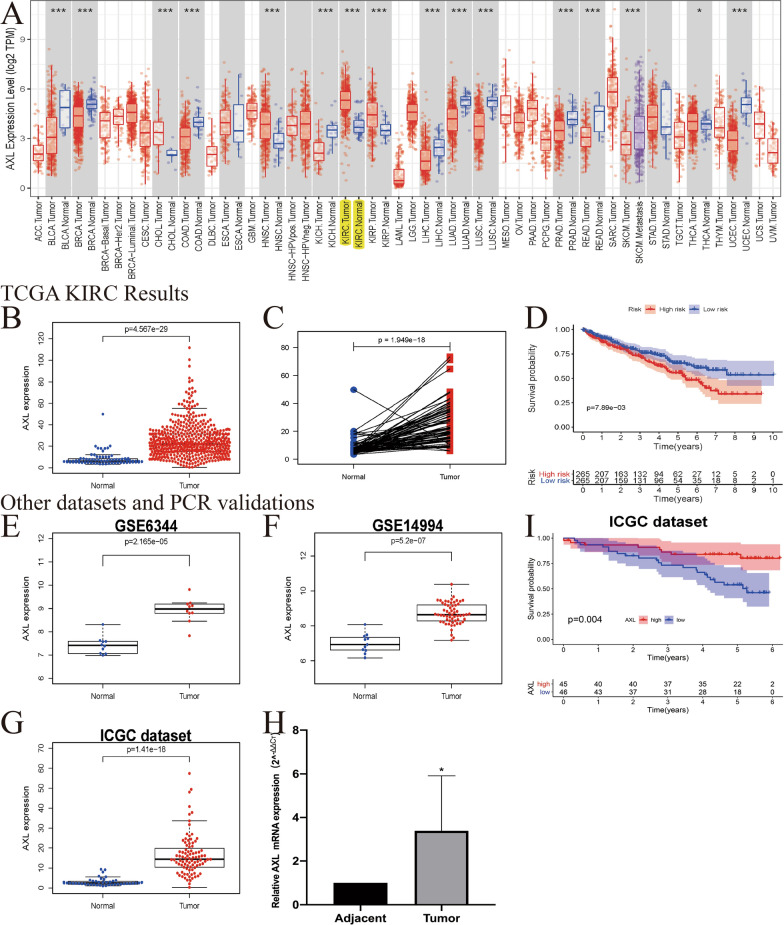
Fig. 1.
The expression and prognosis of AXL in ccRCC; A the expression of AXL in various cancers by using TCGA database; B relative expression levels of the AXL expression between the ccRCC and normal tissues in TCGA dataset (N = 72; T = 539); C pairwise boxplot of the AXL expression between the matched ccRCC and normal tissues in TCGA dataset (N = 72; T = 72); D Kaplan–Meier curves in the TCGA database; E Boxplot of the AXL expression in GSE6344 (N = 10; T = 10); F boxplot of the AXL expression in GSE14994 (N = 11; T = 59); G Boxplot of the AXL expression in the ICGC dataset (N = 45; T = 91); H qRT-PCR results (N = 6; T = 6); I Kaplan–Meier curves in the ICGC dataset

