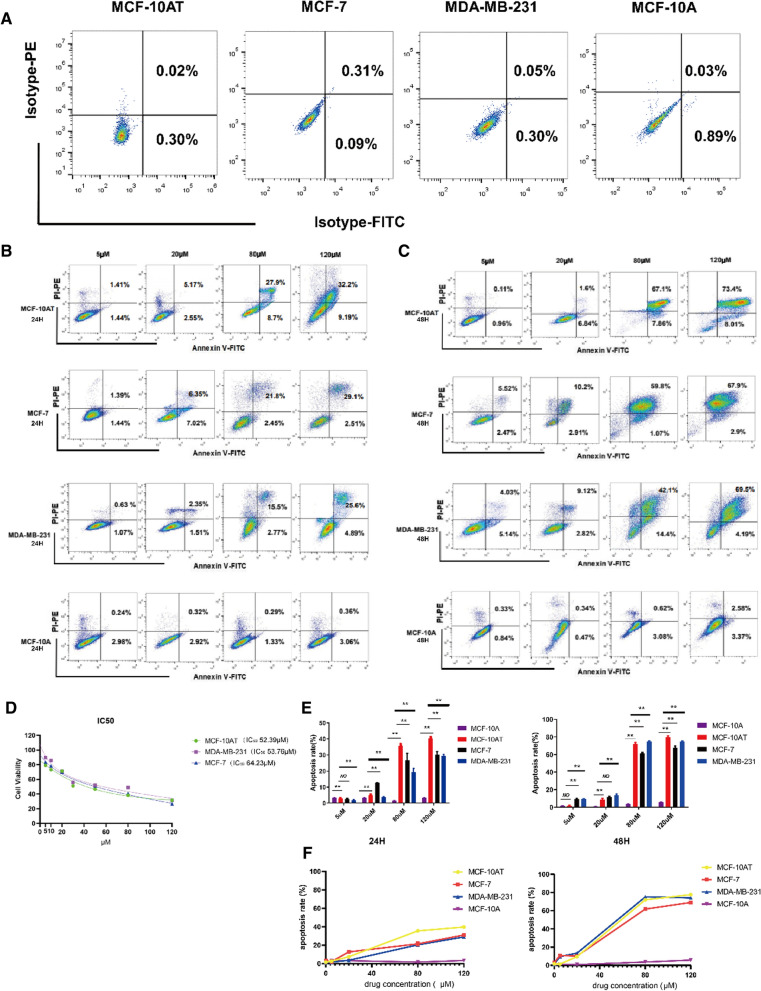
Fig. 3.
A, B Flow cytometry was used analysis of apoptotic cells induced by Que using the annexin V/PI double staining assay. Representative dot plots of Annexin V/PI staining. Cells were treated with Que at 5 µM, 20 µM, 80 µM and 120 µM for 24 h and 48 h, respectively. 10,000 cells were analyzed by flow cytometry. The results are expressed as mean ± SD of three independent experiments. p ≤ 0.01(**), as compared to the control. C The effects of Que on the proliferation of MCF-10AT, MCF-7 and MDA-MB-231 human breast cancer cells. The cells were treated with Que (5, 10, 20, 40, 60, 80, 100, 120 μM), and the proliferation of the cells was determined by MTT assay. D Column bar graph of apoptotic cells. E The trend of apoptotic cells

