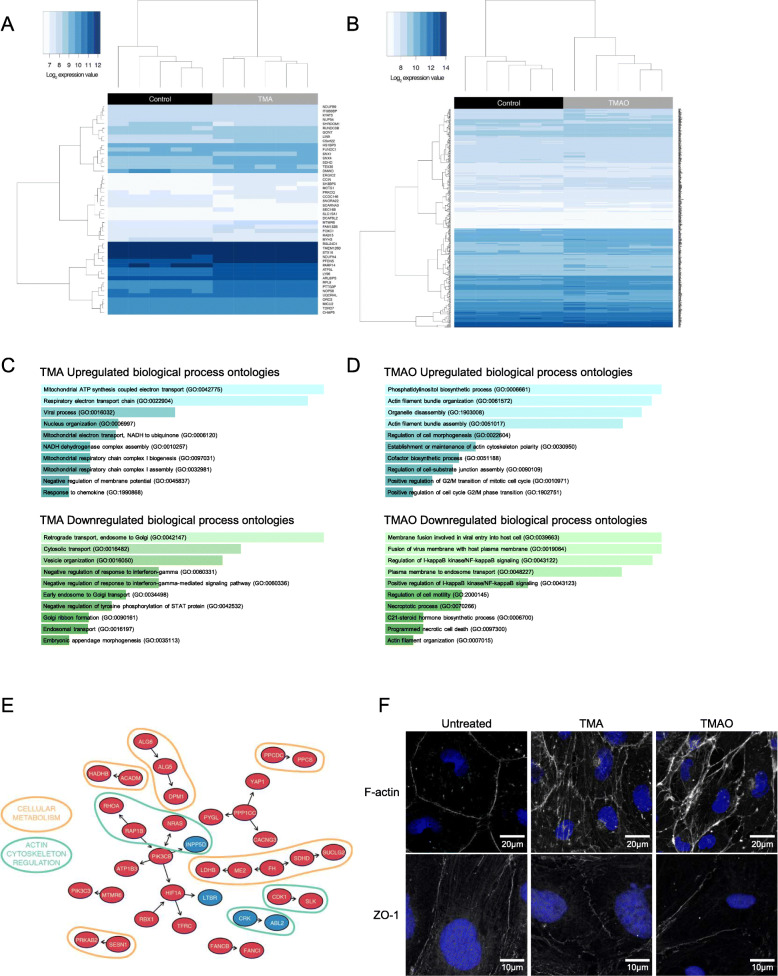
Fig. 2.
Effects of TMA and TMAO on gene expression in hCMEC/D3 cells. A Heatmap showing expression of the 49 genes found to be significantly (PFDR<0.1) differentially expressed upon exposure of hCMEC/D3 cells to 0.4 μM TMA (n = 5 per group). B Heatmap showing expression of the 440 genes found to be significantly (PFDR<0.1) differentially expressed upon exposure of hCMEC/D3 cells to 40 μM TMAO (n = 5 per group). C Biological processes associated with genes found to be significantly upregulated (n = 39) or downregulated (n = 10) upon exposure of cells to TMA. D Biological processes of genes found to be significantly upregulated (n = 341) or downregulated (n = 99) upon exposure of cells to TMAO. Images in (C, D) shown based on Enrichr P value ranking from GO analysis. E Topological analysis of the KEGG networks associated with the 440 genes whose expression was significantly affected upon exposure of cells to TMAO (blue, significantly downregulated; red, significantly upregulated); genes of similar cellular role are highlighted. F Confocal microscopic analysis of expression of fibrillar actin (F-actin) and the tight junction component zonula occludens-1 (ZO-1) in hCMEC/D3 cells following treatment for 24 h with 0.4 μM TMA or 40 μM TMAO. Images are representative of at least three independent experiments

