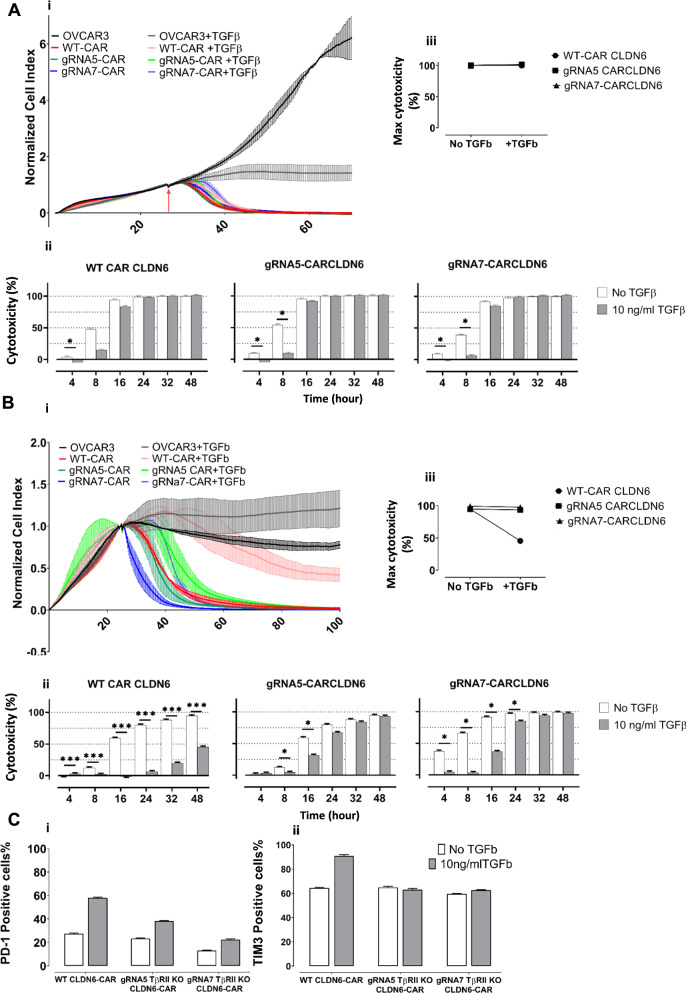
Fig. 8.
TGFβRII KO counteracts CAR T-cell exhaustion induced by TGFβ. A OVCAR-3 cell line were seeded on an xcelligence plate and after 20 h, retrovirally transduced WT or TGFβRII KO CAR CLDN6 T-cells were added at an E:T ratio of 5:1 in the presence or absence of TGFβ. After 48 h, T-cells were collected, washed and counted, and seeded again on a new plate with freshly seeded adherent OVCAR-3 cell line almost growing in saturation phase (20 h). This procedure was repeated one more time to end up with 3 cycles of antigen-specific stimulation. i) A first round of coculture demonstrated that normalized cell indices for WT and TGFβRII KO CAR T-cells were barely affected by the presence of TGFβ; ii) a first round of coculture did also not hamper cytotoxicity of any CAR T-cell group. iii) Max cytotoxicity is given here for a late time point (48 h of coculture) indicating no difference in cytotoxic efficacy. B A third round of coculture demonstrated a vast effect of TGFβ on cytotoxicity of WT CAR CLDN6 T-cells. i) Normalized cell indexes for third round of coculture of WT CAR T-cells or TGFβRIIKO with OVCAR-3 cells indicate a significant difference in cytotoxicity when comparing these groups. ii) Bar chart of the calculated cytotoxicity demonstrating a long-lasting repression of WT CAR CLDN6 T-cells while the TGFβRII KO CAR T-cells recovered from a short suppression phase and remained fully functional in the end (48 h). iii) Max cytotoxicity is given here for a late time point (48 h of coculture) indicating a substantial difference in cytotoxic efficacy. P values were determined by two-way Anova using multiple comparison test. *P < 0.05; **P < 0.01; ***P < 0.001; ****P < 0.0001. In all experiments, mean ± SD of three technical replicates are given and experiments, involving T cells, are repeated for at least three donors. C After third round of coculture with OVCAR-3, the CAR T cells were collected, washed and stained for immune check point and exhaustion markers PD-1 and TIM 3. Bar chart representing the percentage of i: PD-1 and 2: TIM3 positive cells are shown

