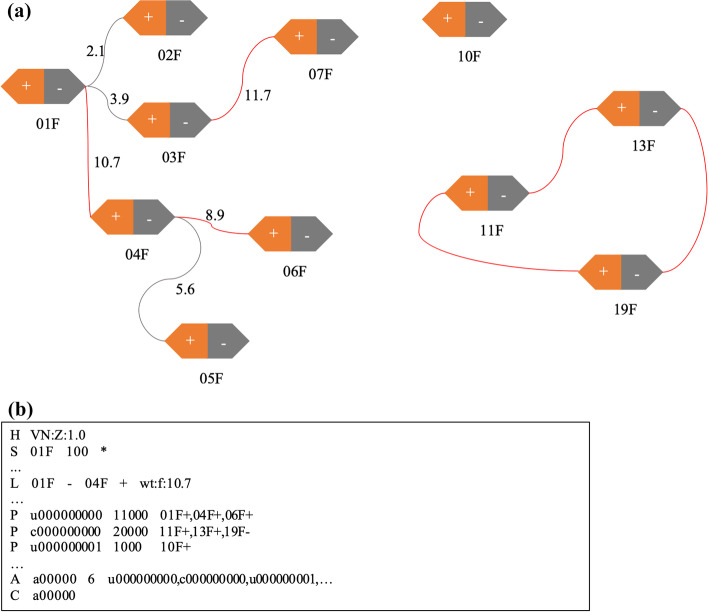
Fig. 1.
Scaffolding graph and SAT format example. a A scaffolding graph. The graph containing 22 vertices and 9 edges is formed by 11 contigs, each contig is split into two vertices, the text below each hexagon is the contig name. Numbers along with the edges are normalized weights, and the grey edges are removed by the pruning process. b A SAT example. All the contigs are represented as sequences (‘S’) in the SAT file, edges are defined as links and tagged as ‘L’, three scaffolds obtained from a are labelled as paths (‘P’) and three scaffolds are gathered in the assembly set tagged as ‘A’, and current assembly is tagged as ‘C’

