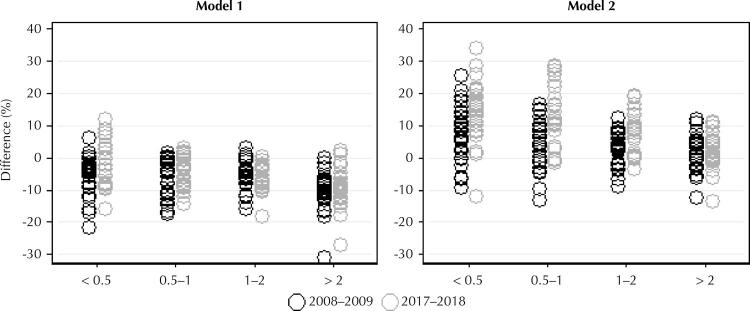
Figure 1. Relative difference (%)a the optimized and observed costs in the strata according to income b, nutritional restrictions (modelsc) e year of survey.
a Calculated [(optimized cost-observed cost)/observed cost] × 100.
b Household income per capita in minimum wages.
c Model 1: adequacy of fruits and vegetables. Model 2: adequacy of fruits and vegetables, macronutrients and fats, calcium, sodium and potassium. Amount of ultra-processed foods less than or equal to the amount observed for both models.

