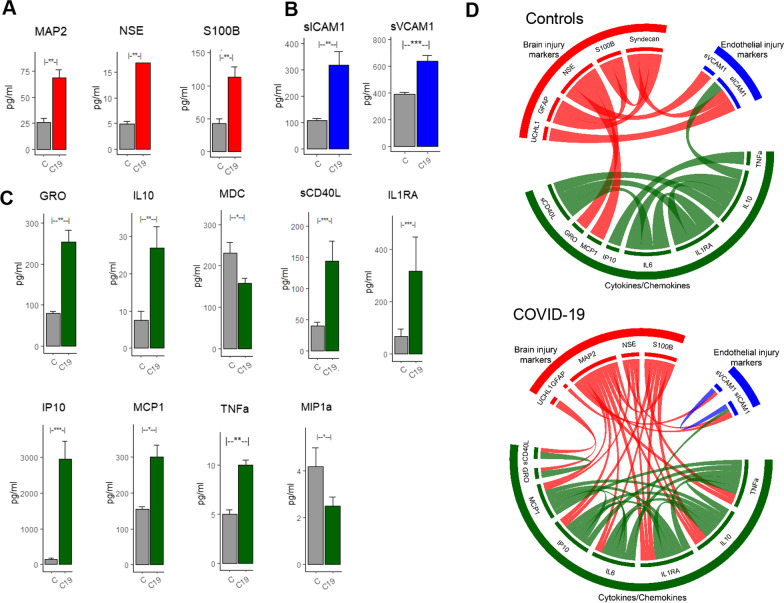
Fig. 1.
Difference in BIM, EIM and CC profile across COVID-19 subjects and matched controls. A BIMs including MAP2, NSE and S100B were significantly (p < 0.05) higher immediately after COVID-19 hospitalization. B sICAM1 and SVCAM1 levels were significantly higher after COVID-19 hospitalization. C Several inflammatory markers including GRO, IL10, sCD40L, IL1RA, IP10, MCP1 and TNFa were significantly higher after COVID-19. MDC and MIP1a were significantly lower after COVID-19. D Chord diagram reveals significant (p < 0.05, Fishers’ test) differences in interactions between the BIM, EM, and CCs across COVID-19 and control groups

