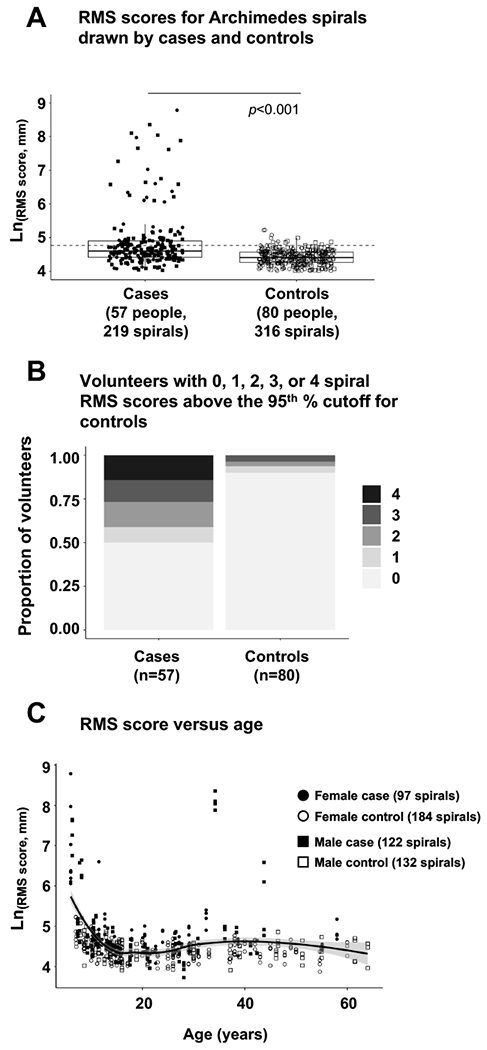
Figure 1: Hand fine motor control deficit in children and adults with classic galactosemia quantified by RMS score of digital Archimedes spirals.

(Panel A) Box and whisker plots of Ln(RMS score) for individual spirals drawn by cases and controls. Each box illustrates the median (heavy line) and upper and lower quartile boundaries for the population presented. Whiskers illustrate the highest and lowest individual data points that are no more than 1.5 times the interquartile range (IQR), and any points falling outside this limit represent suspected outliers. Filled symbols represent individuals with classic galactosemia (cases), open symbols represent individuals without galactosemia (controls). Circles represent females; squares represent males. The dotted horizontal line marks the 95th % cutoff for controls. (Panel B) Proportion of cases and controls presenting 0, 1, 2, 3, or 4 spirals with RMS scores above the 95th % cutoff defined for controls. (Panel C) Individual spiral RMS scores for cases and controls as a function of age. The solid line presents a best-fit curve to the combined data, and the shaded area represents the 95% range for all subjects (cases and controls).
