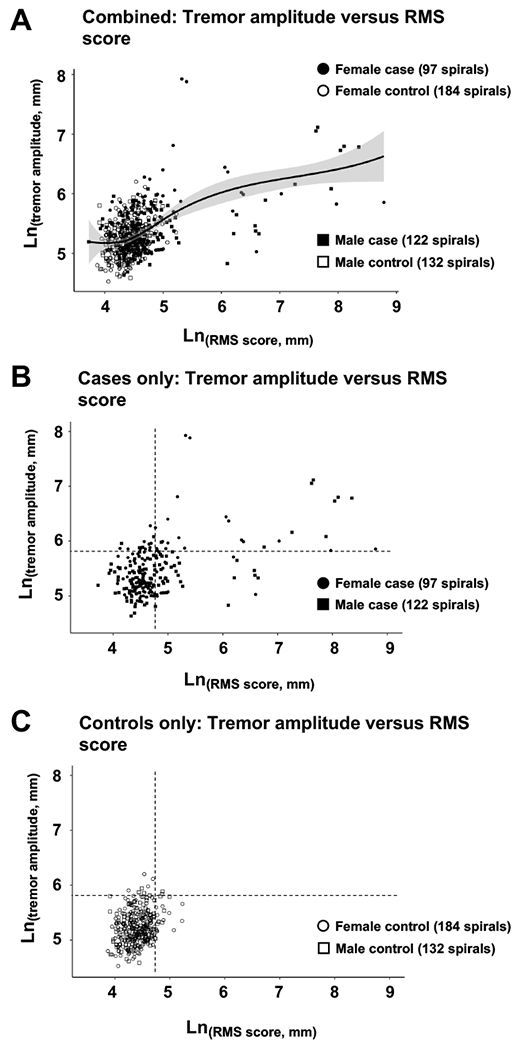
Figure 3: Relationship between RMS score and tremor amplitude of digital Archimedes spirals drawn by cases and controls.

(Panel A) Individual spiral tremor amplitude scores as a function of RMS score for both cases and controls. The solid line presents a best-fit curve to the combined data, and the shaded area represents the 95% range for all subjects. (Panel B) Individual spiral tremor amplitude scores as a function of RMS score for cases only. The dashed lines represent the 95th % cutoffs for Ln(RMS score) and Ln(tremor amplitude) as defined for controls. (Panel C) Individual spiral tremor amplitude scores as a function of RMS score for controls only. The dashed lines represent the 95th % cutoffs for Ln(RMS score) and Ln(tremor amplitude) as defined for controls.
