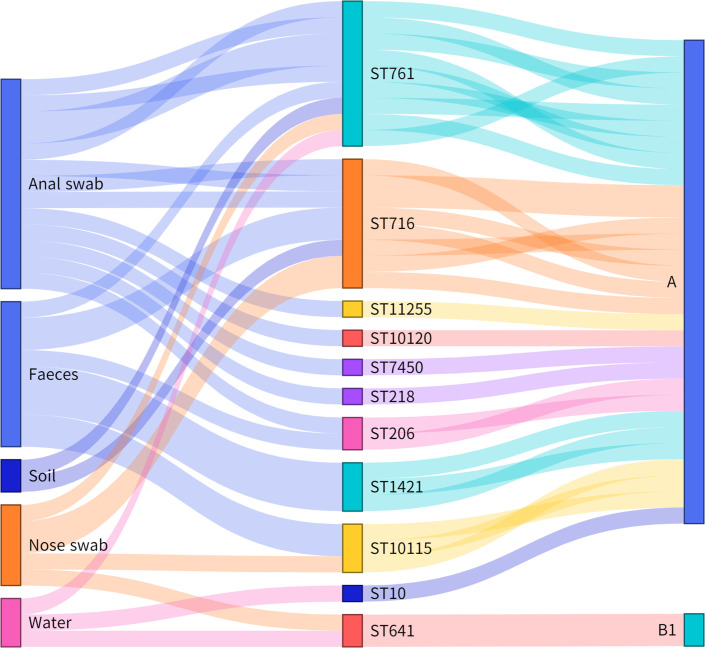
Fig. 1.
Sankey diagram demonstrating the tet(X4)-positive E. coli STs, phylogroups and the strain source. The lines are drawn connecting source, STs and phylogroups based on corresponding information from the 32 tet(X4)-positive strains. The diameter of the line is proportional to the number of isolates.

