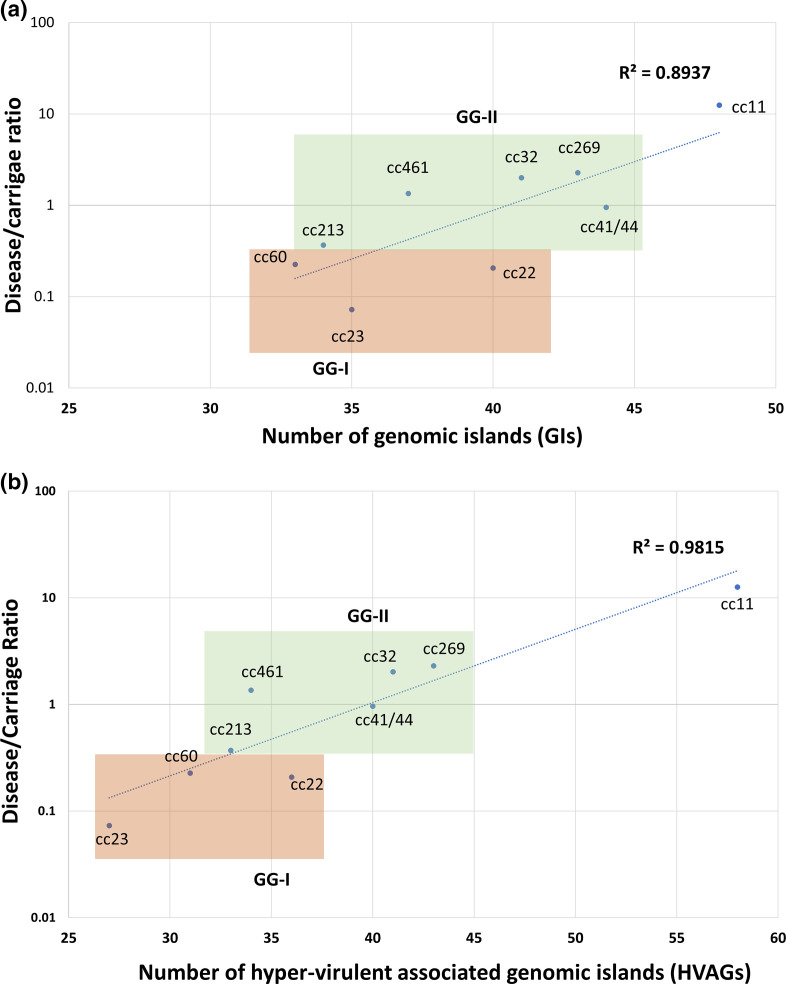
Fig. 3.
Disease/carriage ratio of each pathogenic clonal complex plotted against all 82 GIs of the accessory genome (a) and hypervirulence-associated genes (HVAGs) consisting of 35 GIs and 26 genes (b). The disease/carriage ratio was an in silico calculation (see Methods and Table 1). GG-I is shaded in orange while GG-II is shaded in green.

