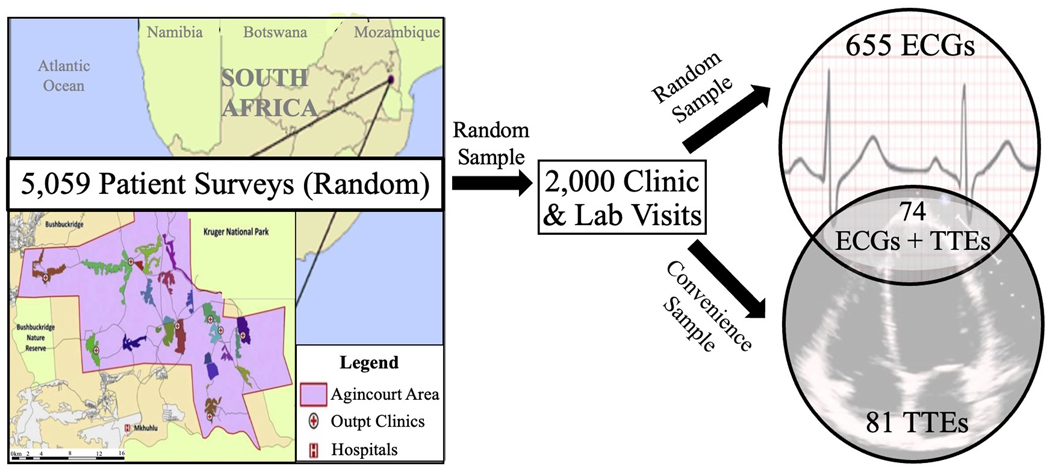
Figure 1. Flow Diagram of Patient Enrollment into the Study.
The insert on the left lower quadrant of the map represents the Agincourt study area (450 km2) in the North-East region of South Africa – where a longitudinal cohort of 5,059 people aged ≥40 years was first assembled in 2014 through random sampling from the 2013 census. From this initial cohort, a first sub-sample of 2,000 patients was randomly selected to undergo clinic visits and laboratory analyses to generate a cardiometabolic profile. Among those, another sub-set of 729 patients was randomly selected to undergo ECG evaluation. Finally, a sub-set of 155 patients was selected by convenience sampling (based on sonographer availability on site during clinic visits) to undergo TTE evaluation, with 74 patients completing both ECG and TTE evaluation. ECG, electrocardiogram; TTE, transthoracic echocardiogram.

