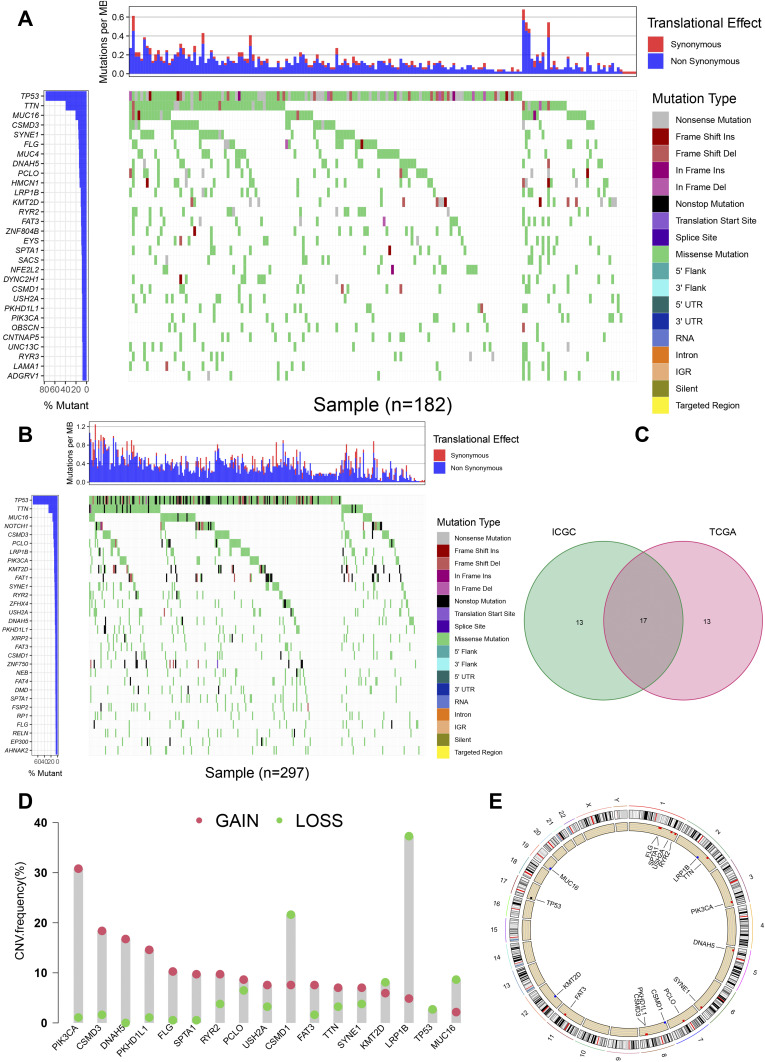
Figure 2.
Overview of commonly mutated genes in esophageal cancer. (A) Waterfall Plot of commonly mutated genes in esophageal cancer from TCGA database. The figure on the left shows the frequency of mutations. Genes are arranged according to the frequency of mutations. The different types of mutations are shown on the right. (B) Waterfall Plot of frequently mutated genes in esophageal cancer in the ICGC cohort. (C) Venn diagram of frequently mutated genes covered by both TCGA and ICGC cohorts. (D) The frequency of CNV of 17 common genes. The green dot represents the loss of CNV, while the pink dot represents the gain of CNV. (E) The position distribution of CNV changes of these 17 genes on 23 chromosomes.

