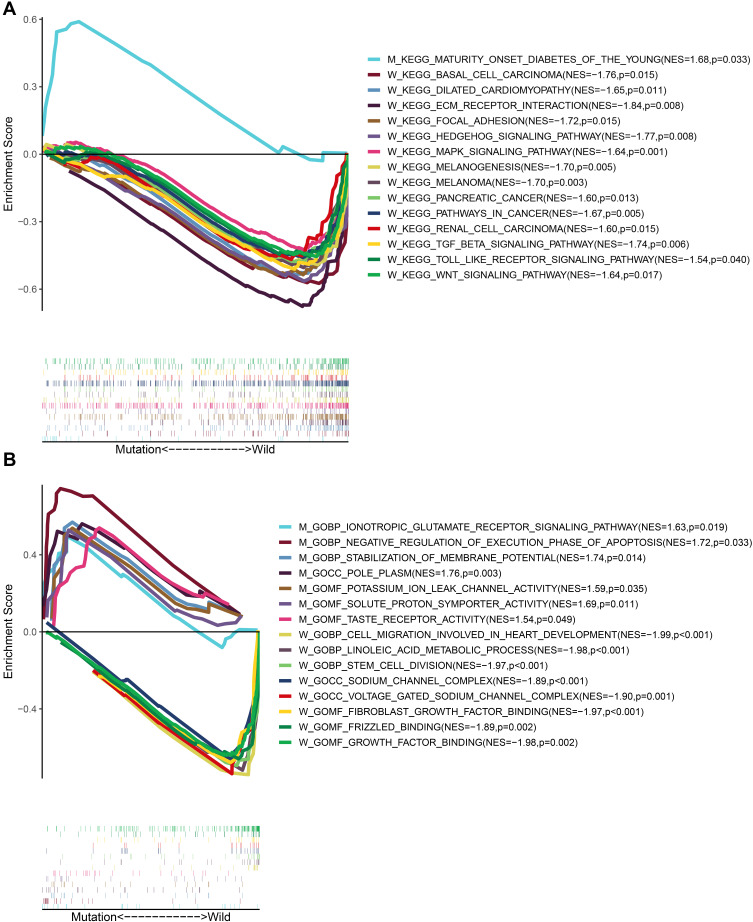
Figure 7.
Enrichment analysis of GO and KEGG based on CSMD1 mutation status. (A) Pathways significantly enriched in CSMD1 wild group and CSMD1 mutant group, respectively. W and M represents CSMD1 wild group and CSMD1 mutant group, respectively. (B) BPs, MFs and CCs were significantly enriched in the CSMD1 wild group and CSMD1 mutant group, respectively.

