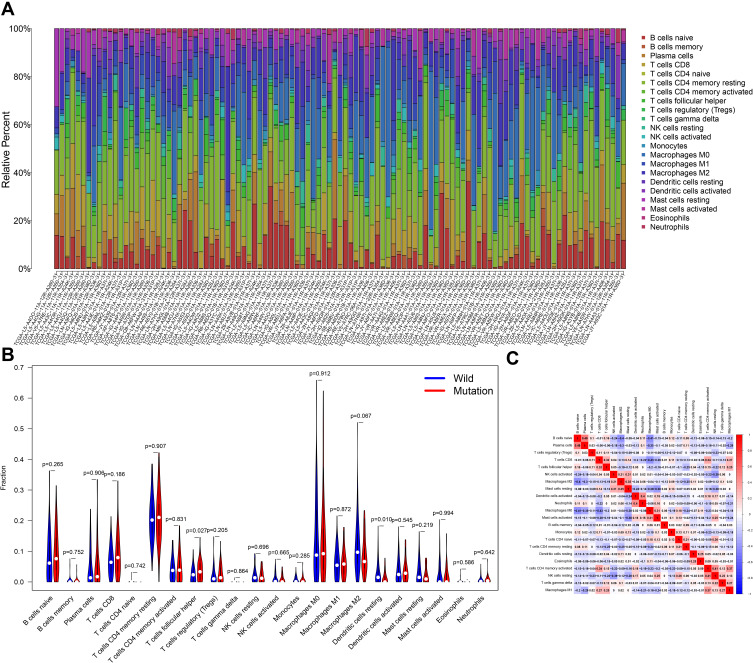
Figure 8.
CSMD1 mutation is associated with tumor invasion of immune cells. (A) Stacked bar chart shows 22 immune cell distributions in each sample. (B) A violin chart is showing the difference in immune cell infiltration between the CSMD1 mutant group and the CSMD1 wild group. (C) Correlation matrix between immune cells. Red represents positive correlation, while blue represents negative correlation.

