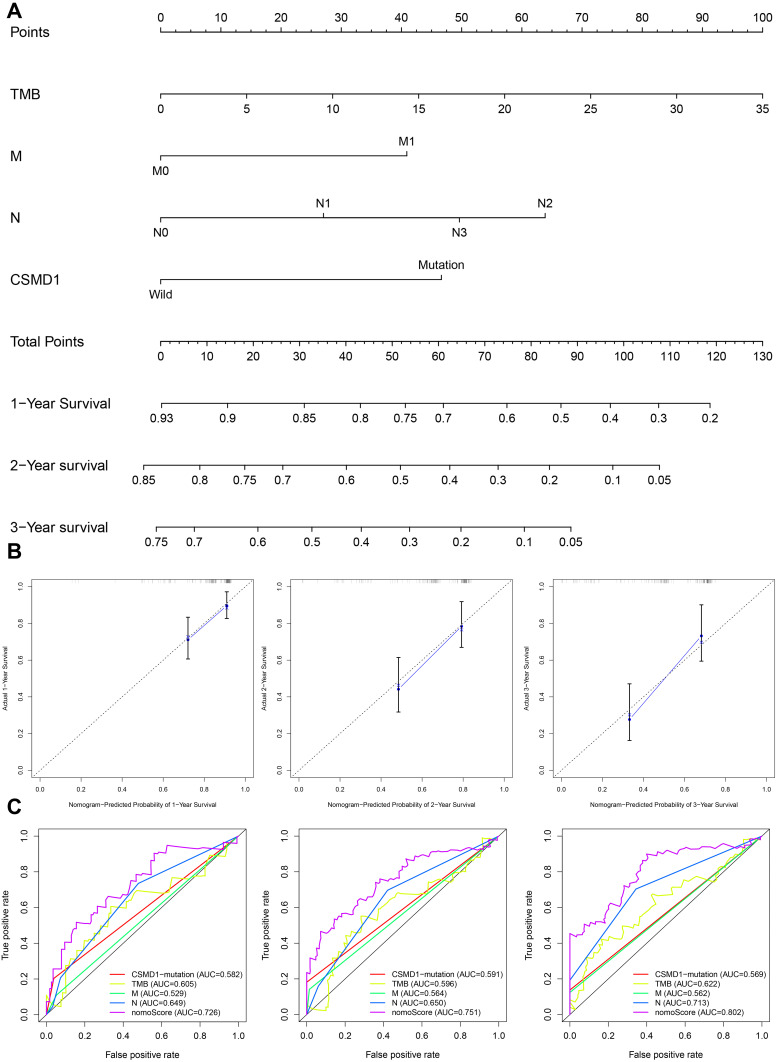
Figure 11.
Construction and verification of Nomogram. (A) The nomograph composed of M, N, TMB and CSMD1 mutation status is used to predict the survival probability of patients with esophageal cancer at 1, 2 and 3 years survival probability. (B) It is observed in the calibration curve that the OS predicted by the combined model is basically the same as the actual OS. (C) The multi-factor ROC curve reveals that the nomogram has the best predictive performance. The ordinate represents the true positive rate, while the abscissa represents the false positive rate.

