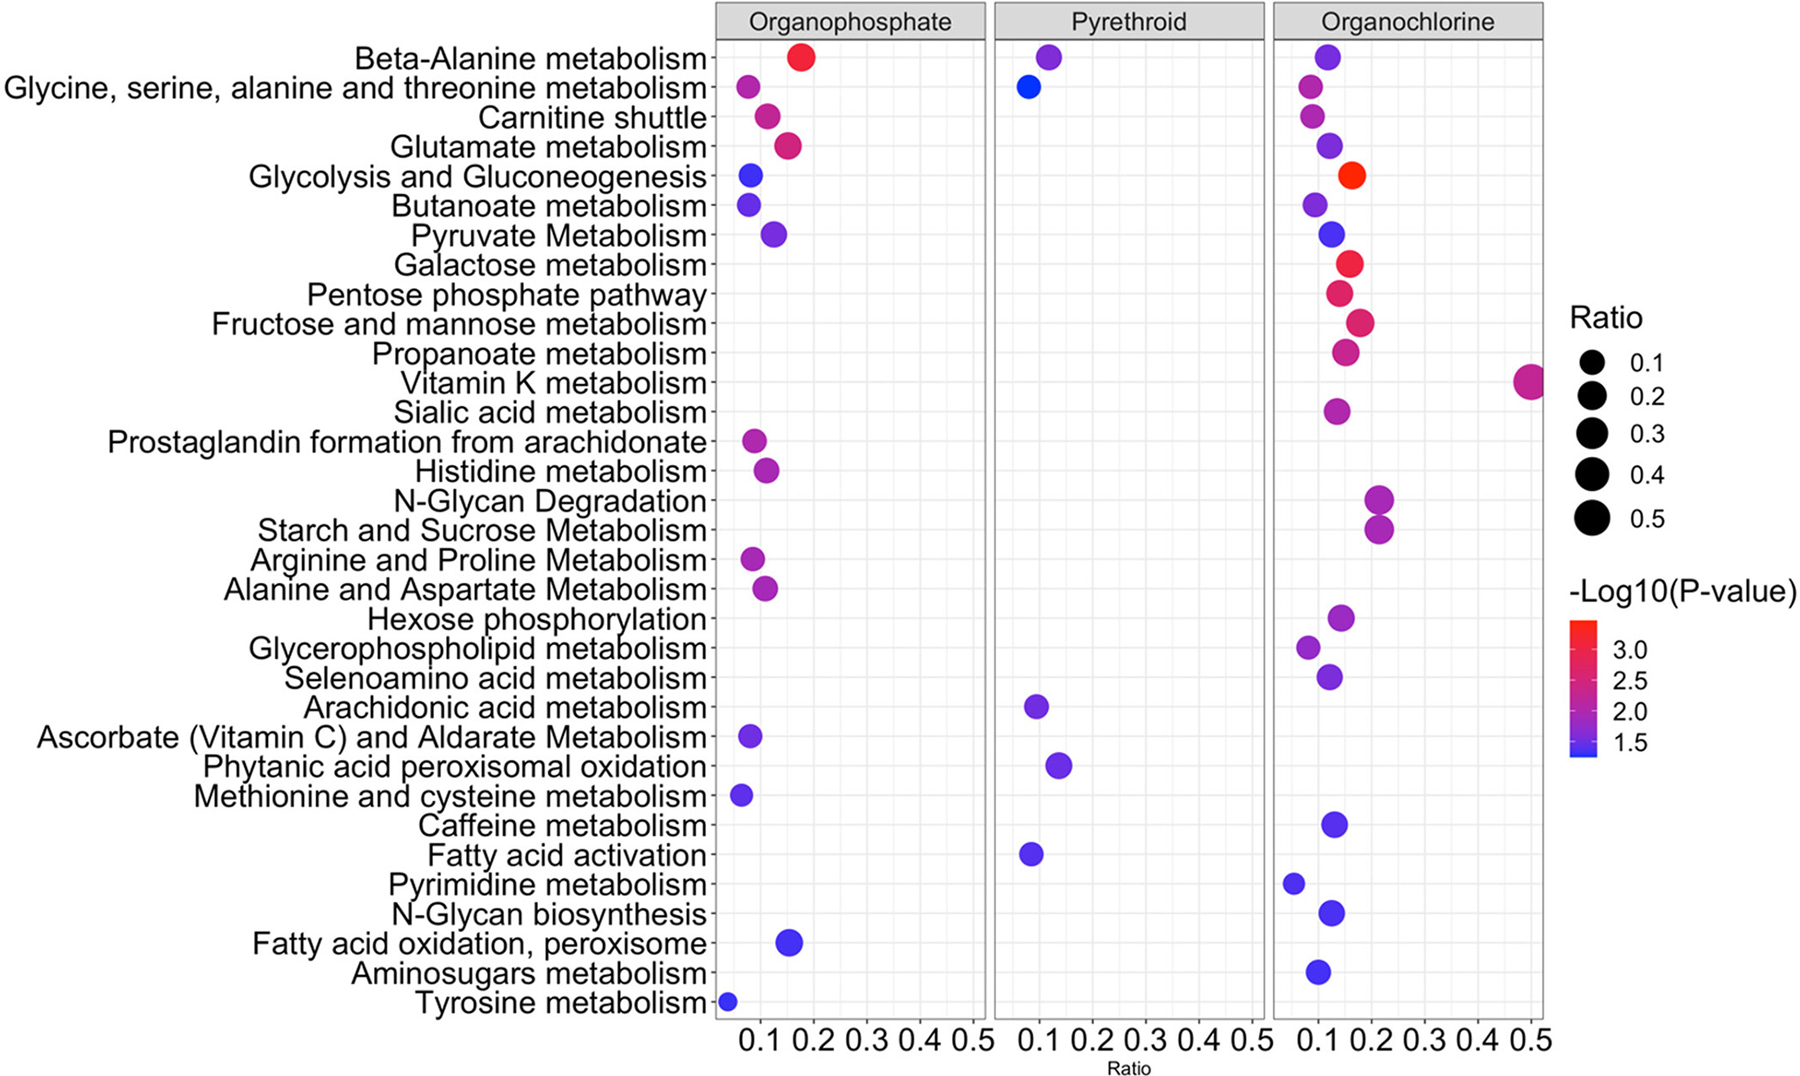
Figure 2.

Metabolic pathways correlated with pesticides from a serum metabolome-wide association study. The vertical axis represents the pathways associated with pesticides. The circle radius is proportional to the number of correlated metabolite features within each pathway (ratio). The horizontal axis also represents the ratio. The color represents the −log 10 (p-value) of each pathway.
