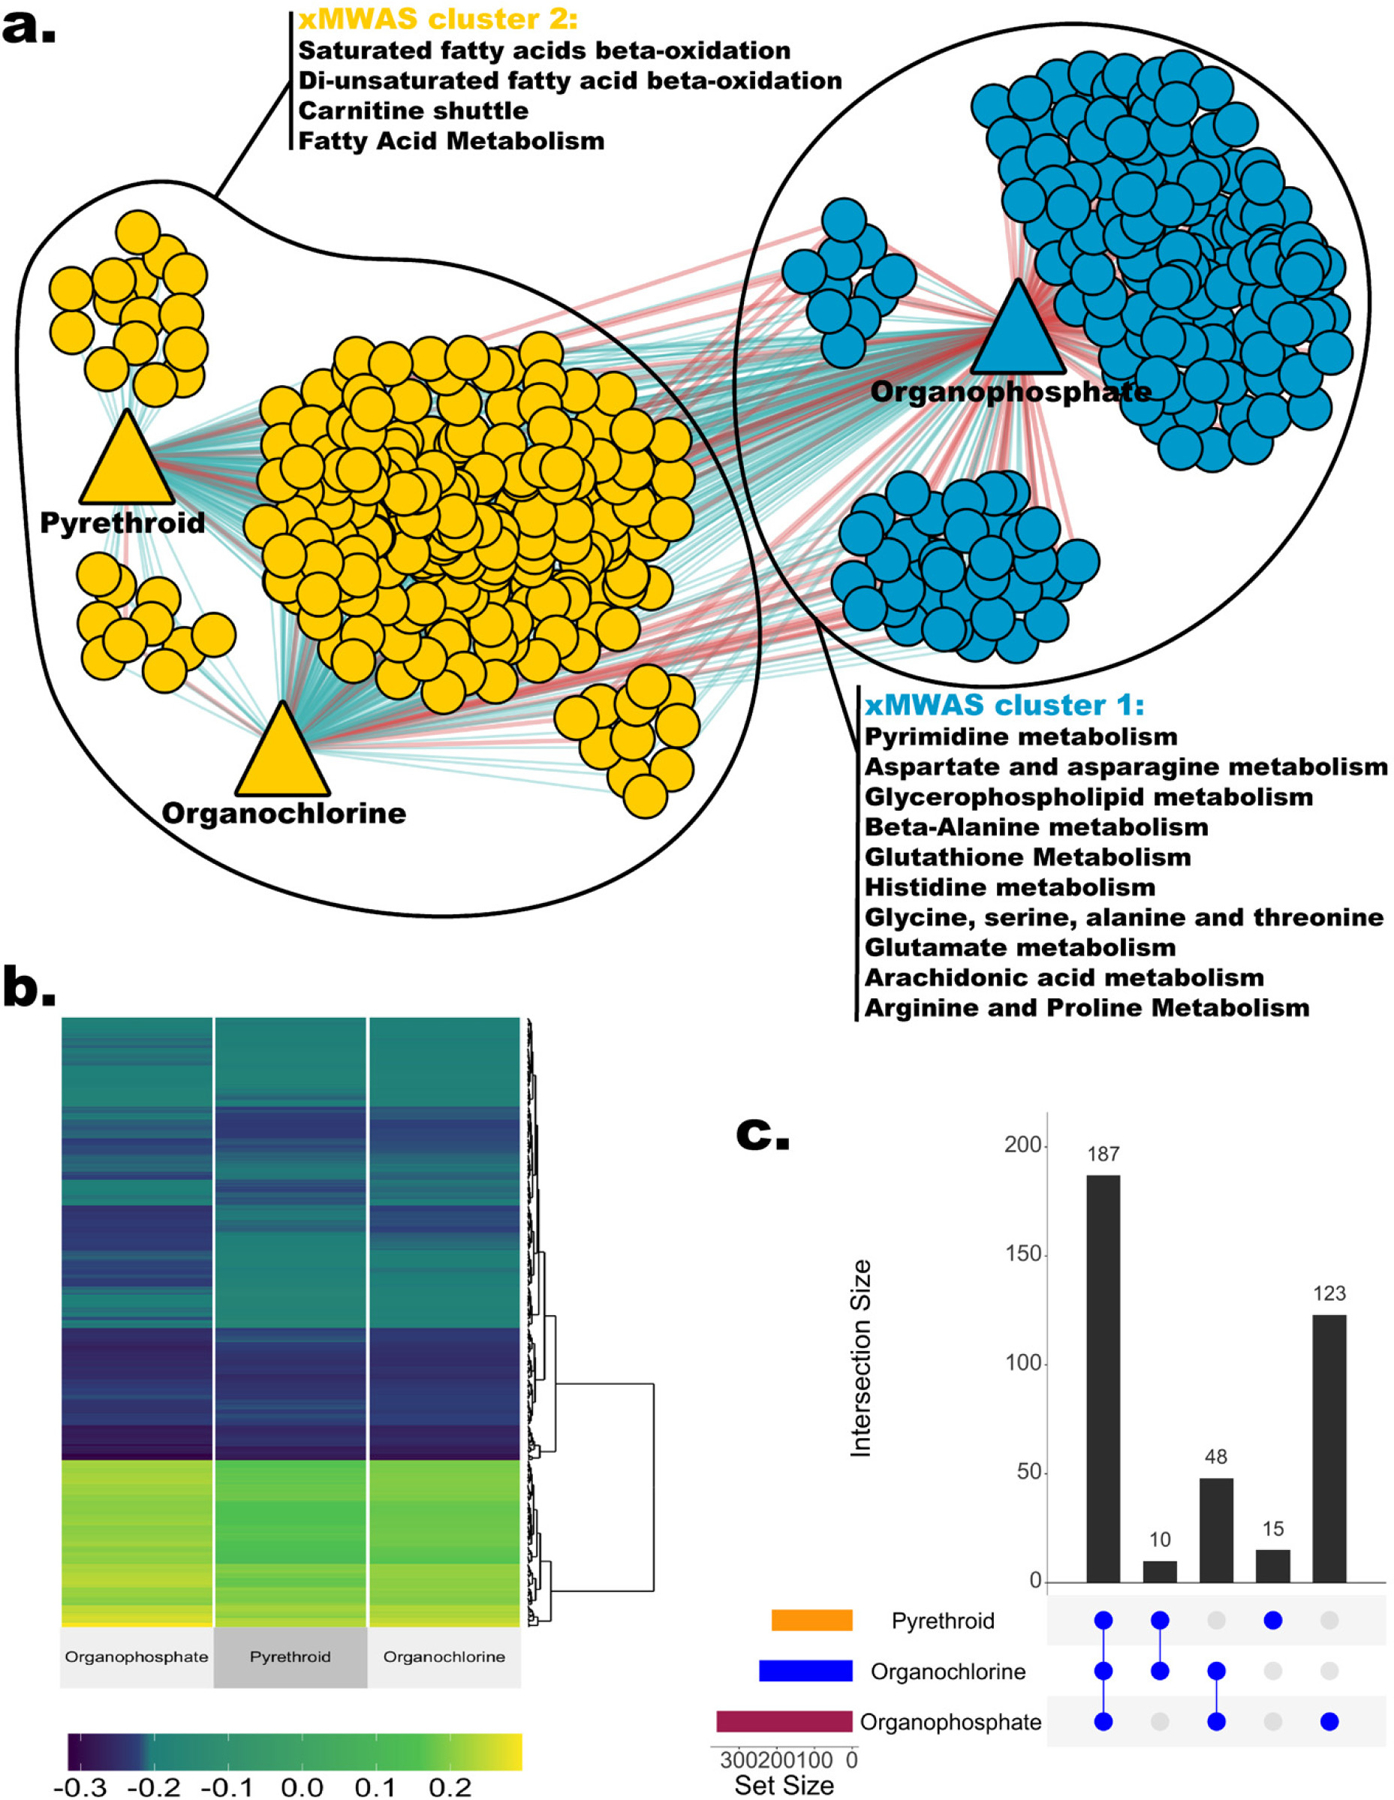
Figure 3.

Integrative network analysis with xMWAS. (a) The metabolome-pesticide network revealed two metabolomic communities. Only metabolomic features with an association score >0.2 and p < 0.05 were included in the network. Round nodes represent metabolomic features, and triangle nodes represent three pesticides. The edges’ color represents the direction of association (red: positive, green: negative). Multilevel community detection algorithm identified two clusters, represented by different node colors. (b) Heatmap of the association scores between metabolomic features and pesticides. Only features included in the network are shown here. (c) UpSet plot shows the number of features associated with each pesticide group and the intersection size.
