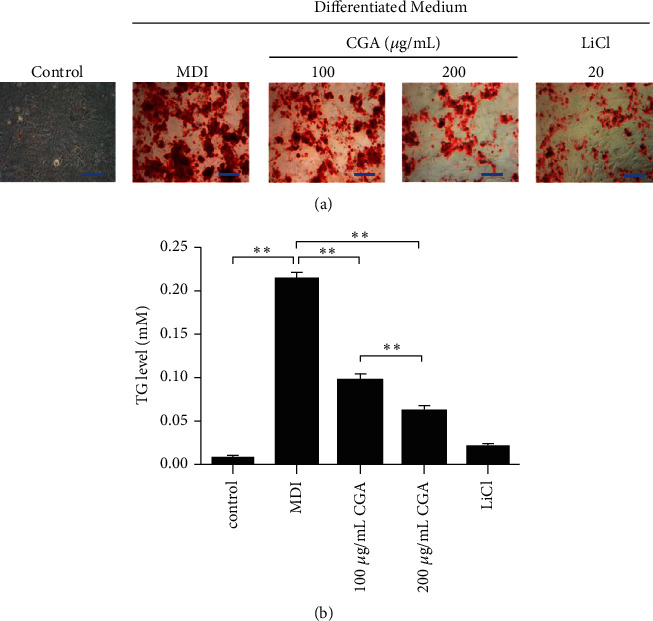
Figure 4.

Effects of CGA on the adipogenesis of 3T3-L1 cells induced for 12 days. (a) Intracellular lipid droplets were stained with Oil Red O.Scale bar: 200 μm. (b) Intracellular triglyceride concentrations. Data are presented as the mean ± SE from three independent experiments. ∗P < 0.05, ∗∗P < 0.01.
