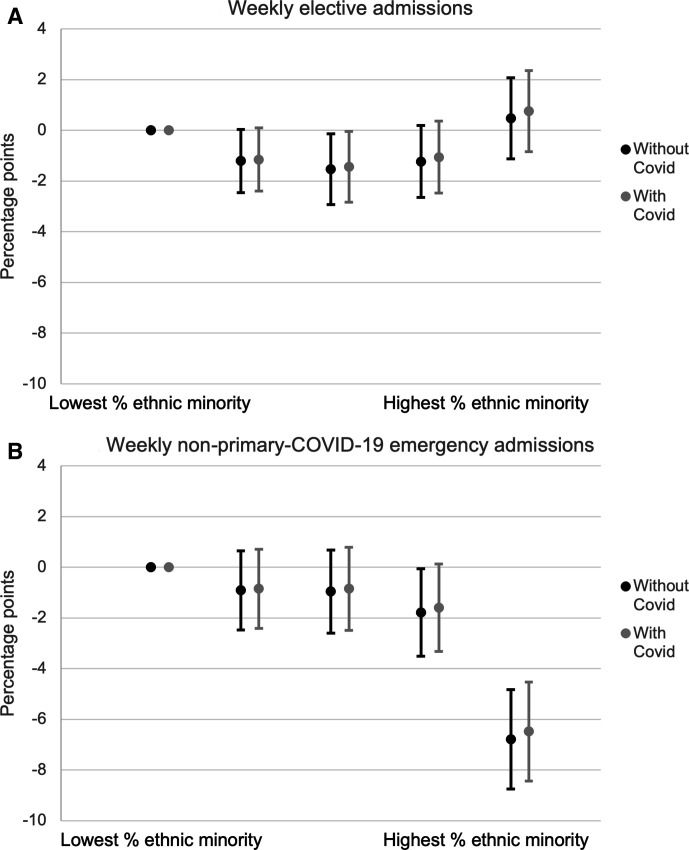
Figure 3.
Percentage point change in admissions during COVID-19 period by ethnic minority population quintile, controlling for prior need and socioeconomic deprivation quintile. Source: authors’ calculations using NHS Digital Hospital Episode Statistics. Note: panel A shows the coefficients on the interaction between ethnic minority population quintiles and COVID-19 period indicators and the 95% CIs. These measure the difference between each quintile’s mean percentage point reduction in elective admissions during the COVID-19 period relative to the first quintile. The regressions also include week fixed effects, measures of clinical need interacted with the COVID-19 period and in the second case, local COVID-19 rates lagged by a week. Panel B shows the same for emergency admissions. The online supplemental appendix includes the raw coefficients (specifications 5 and 6).

