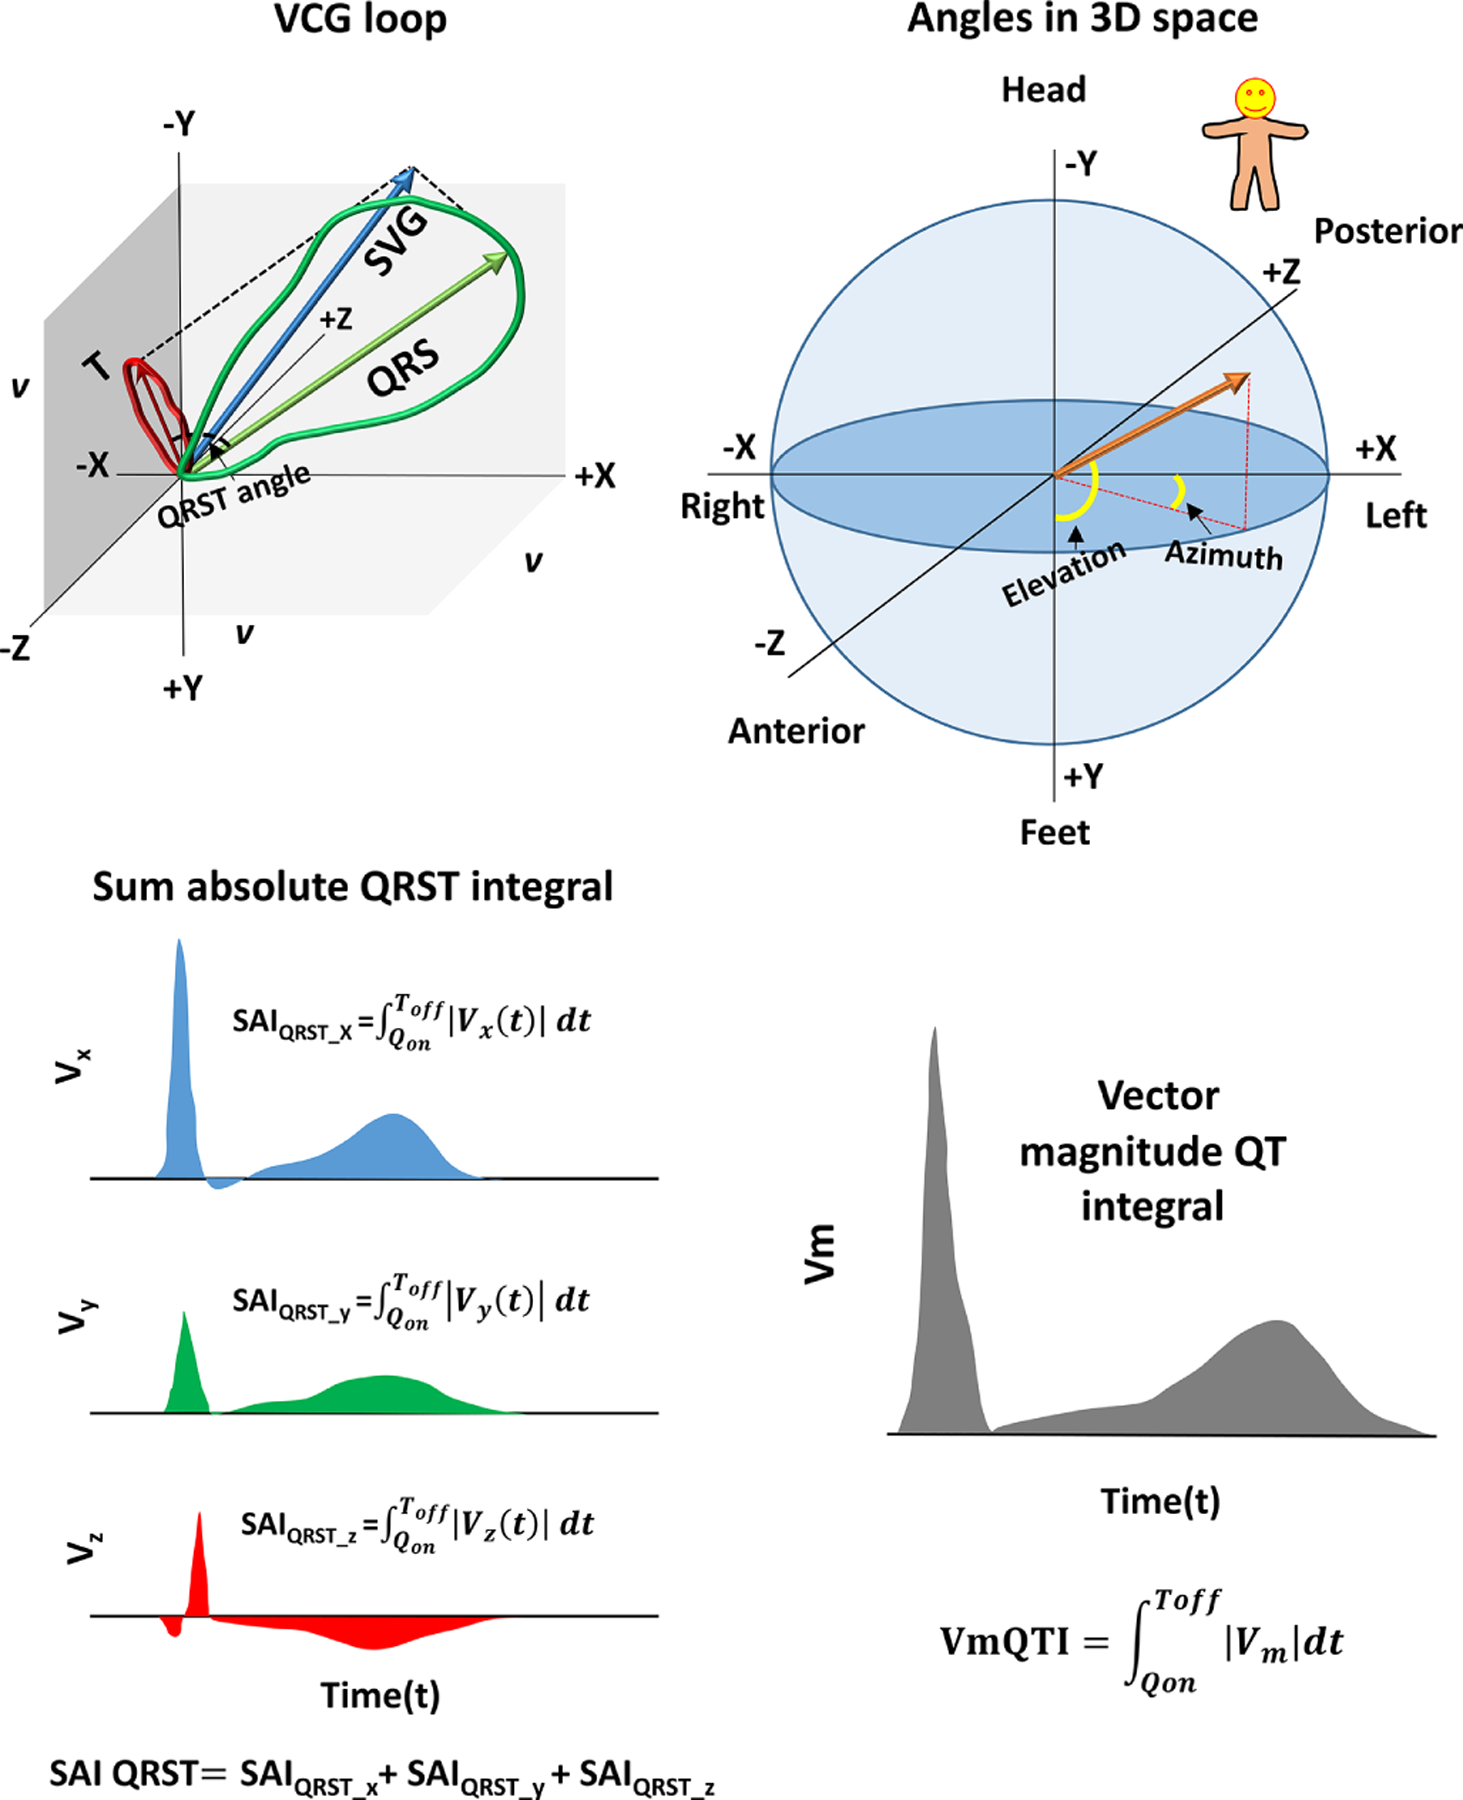
Figure 1.

GEH measurements. (A) Spatial ventricular gradient (SVG) vector (blue) obtained as a vector sum of QRS (green) and T vector (red). Spatial QRS-T angle is the 3D angle between QRS and T vector. (B) Orientation of the angles (azimuth and elevation) in 3D space. (C) Sum absolute QRST integral (SAIQRST). (D) Vector magnitude QT integral.
