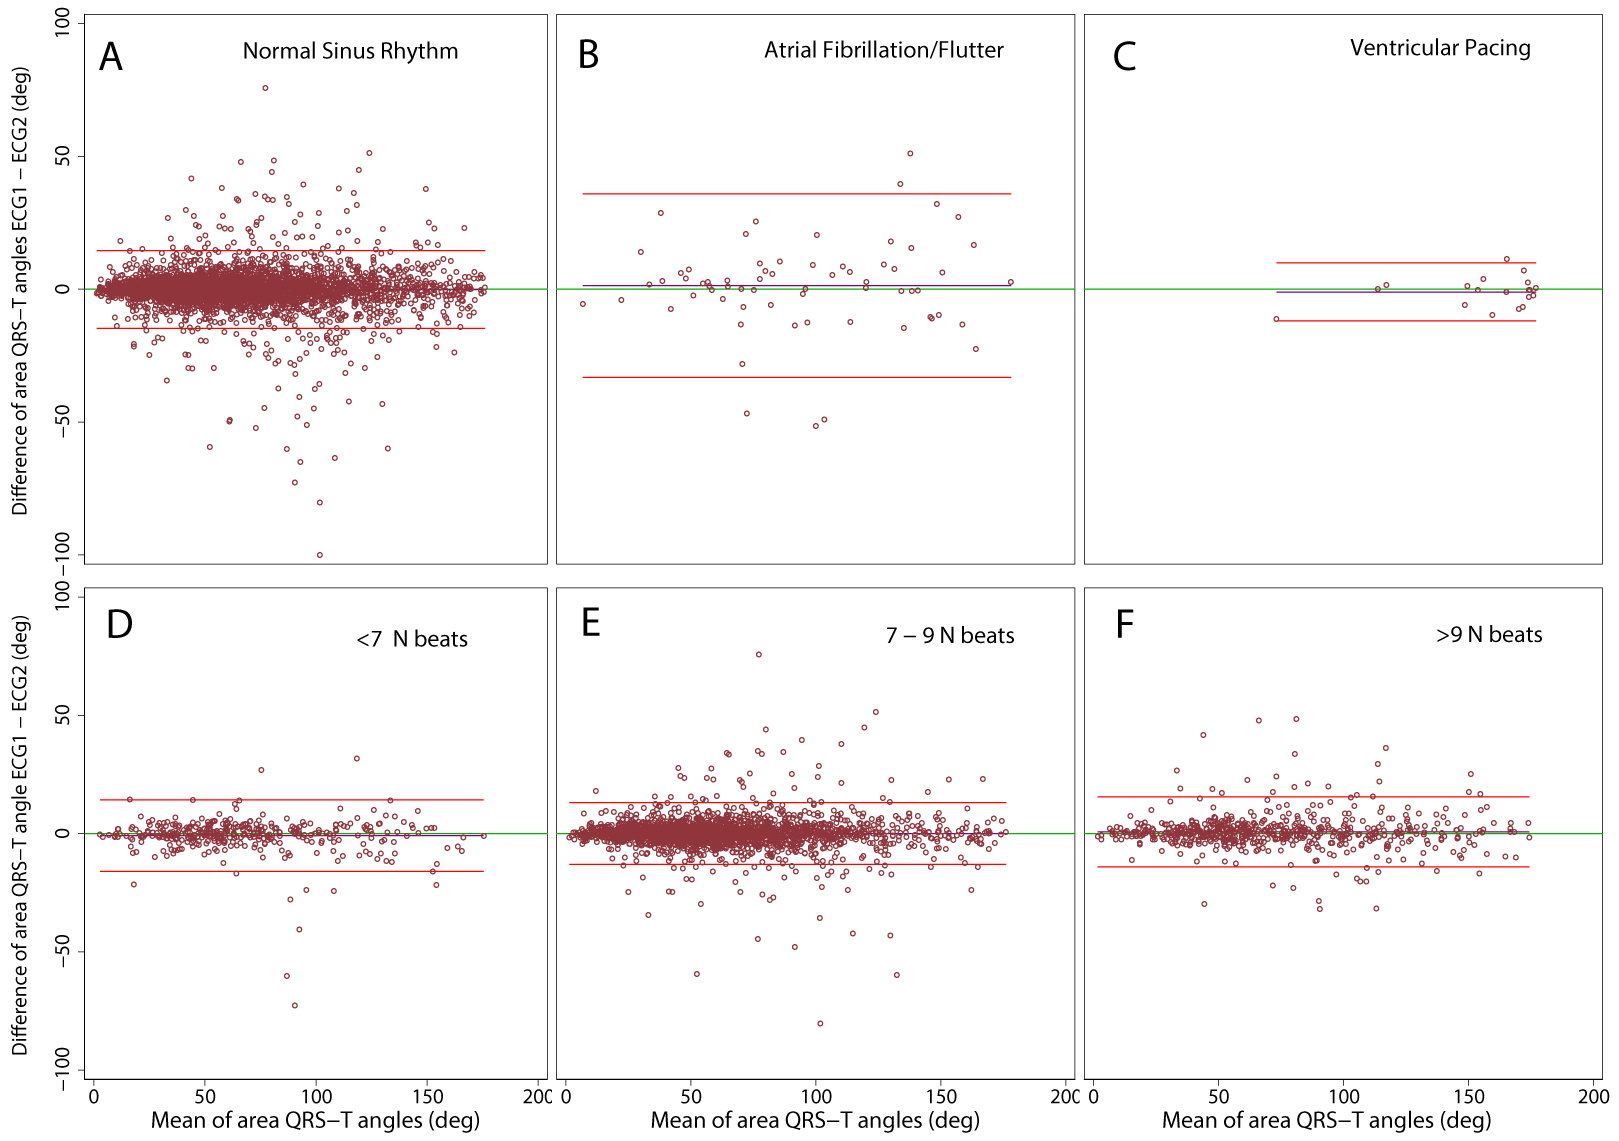
Figure 3.

Bland-Altman plots demonstrating agreement of spatial area QRS-T angle on two ECGs. Median beats were constructed in (A) normal sinus (N) rhythm, (B) atrial fibrillation/flutter, (C) ventricular pacing, including (D) ≤6 N beats, (E) 7–9 N beats, (F) ≥10 N beats. The scatterplot presents paired differences (Y-axis), plotted against pair-wise means (X-axis). The reference line indicates the perfect average agreement, Y = 0. The central green line indicates the mean difference between the two measurements, or mean bias. Upper and lower lines represent the mean ± 2 standard deviations (SD), or 95% limits of agreement.
