
Figure 4.
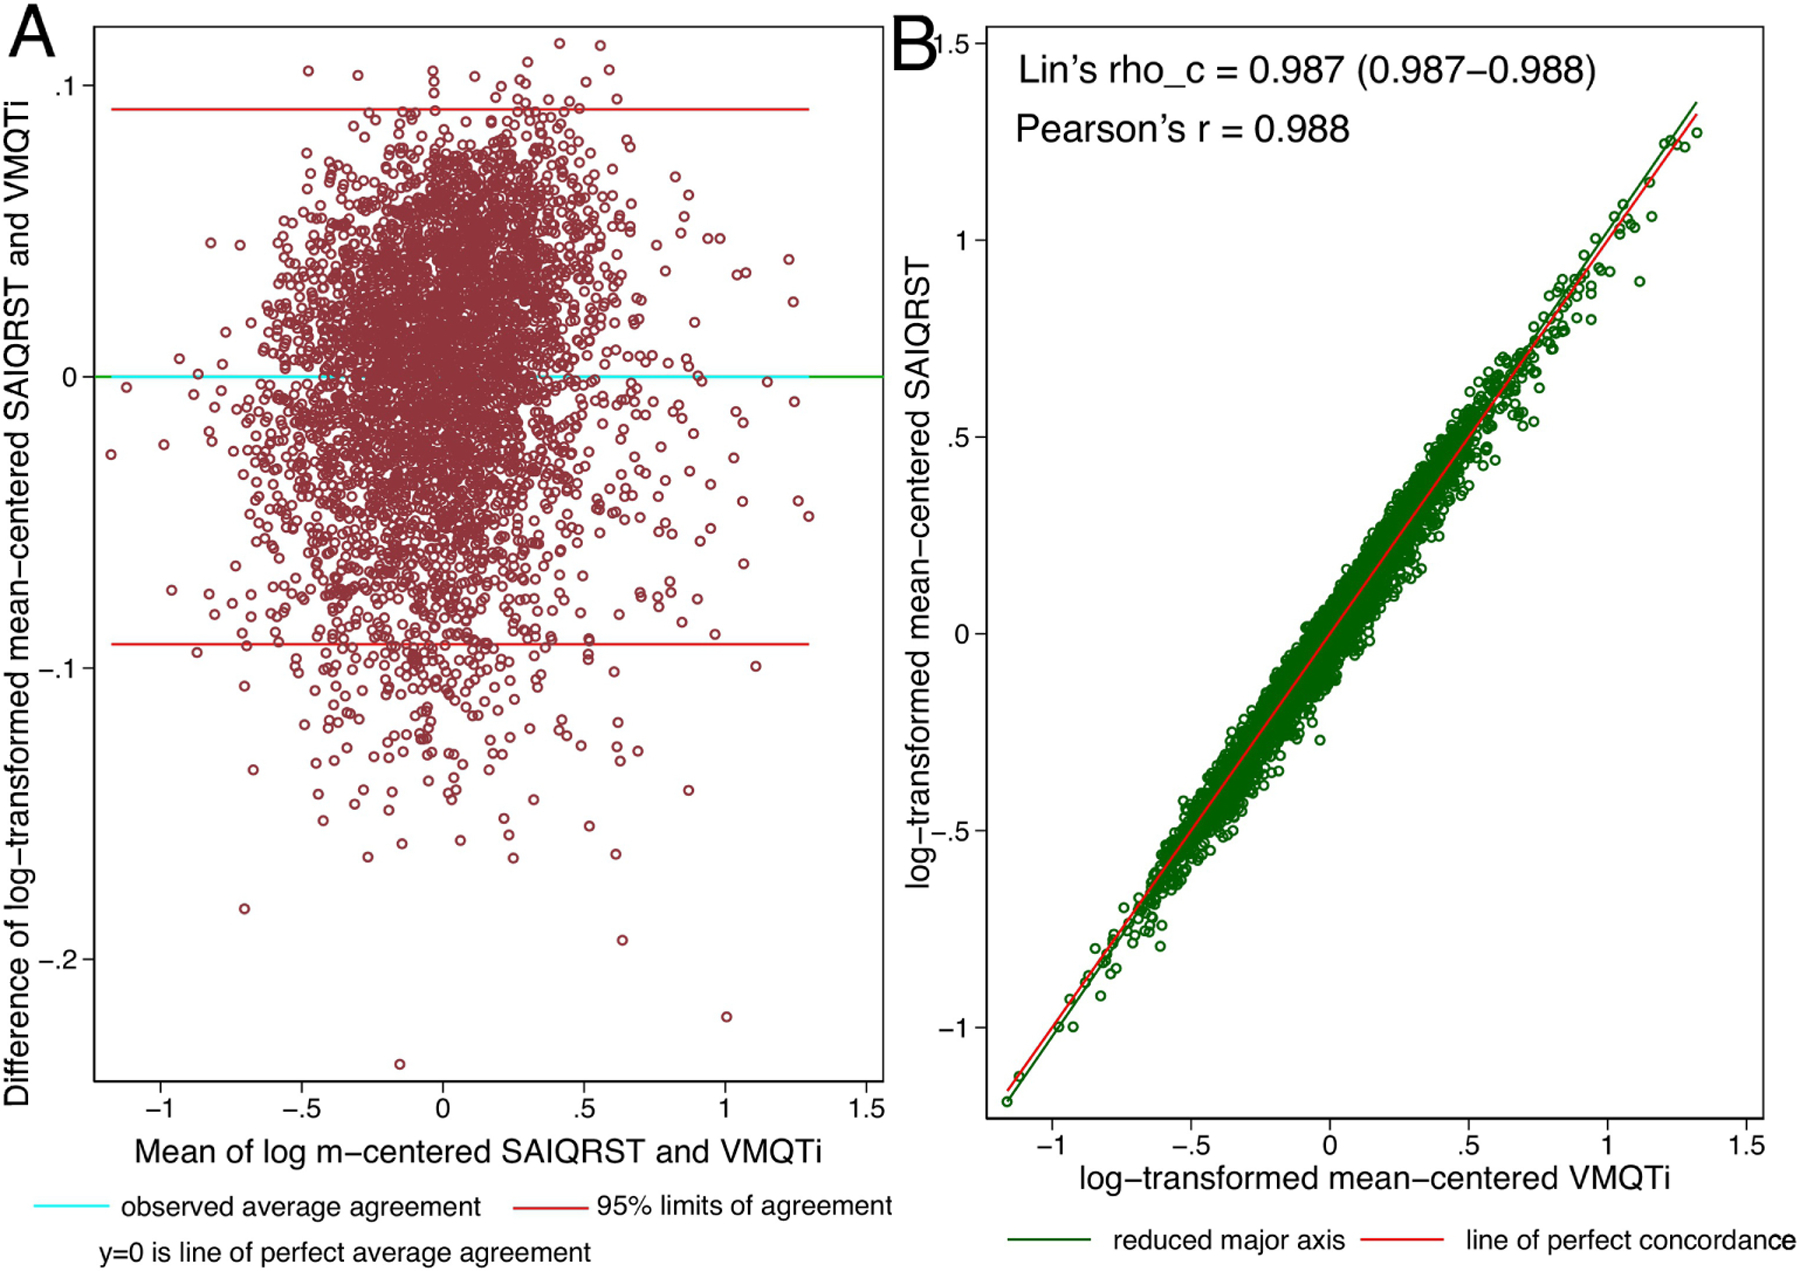
(A). Bland-Altman plot demonstrating agreement of mean-centered log-transformed SAIQRST and VMQTi. Definitions given in Figure 3 legend. (B). Concordance scatterplot of the mean-centered log-transformed SAIQRST and VMQTi. The reduced major axis of the data (green) goes through the intersection of the means and has the slope given by the sign of Pearson’s r and the ratio of the standard deviations. The reference red line shows the perfect concordance, Y = X.