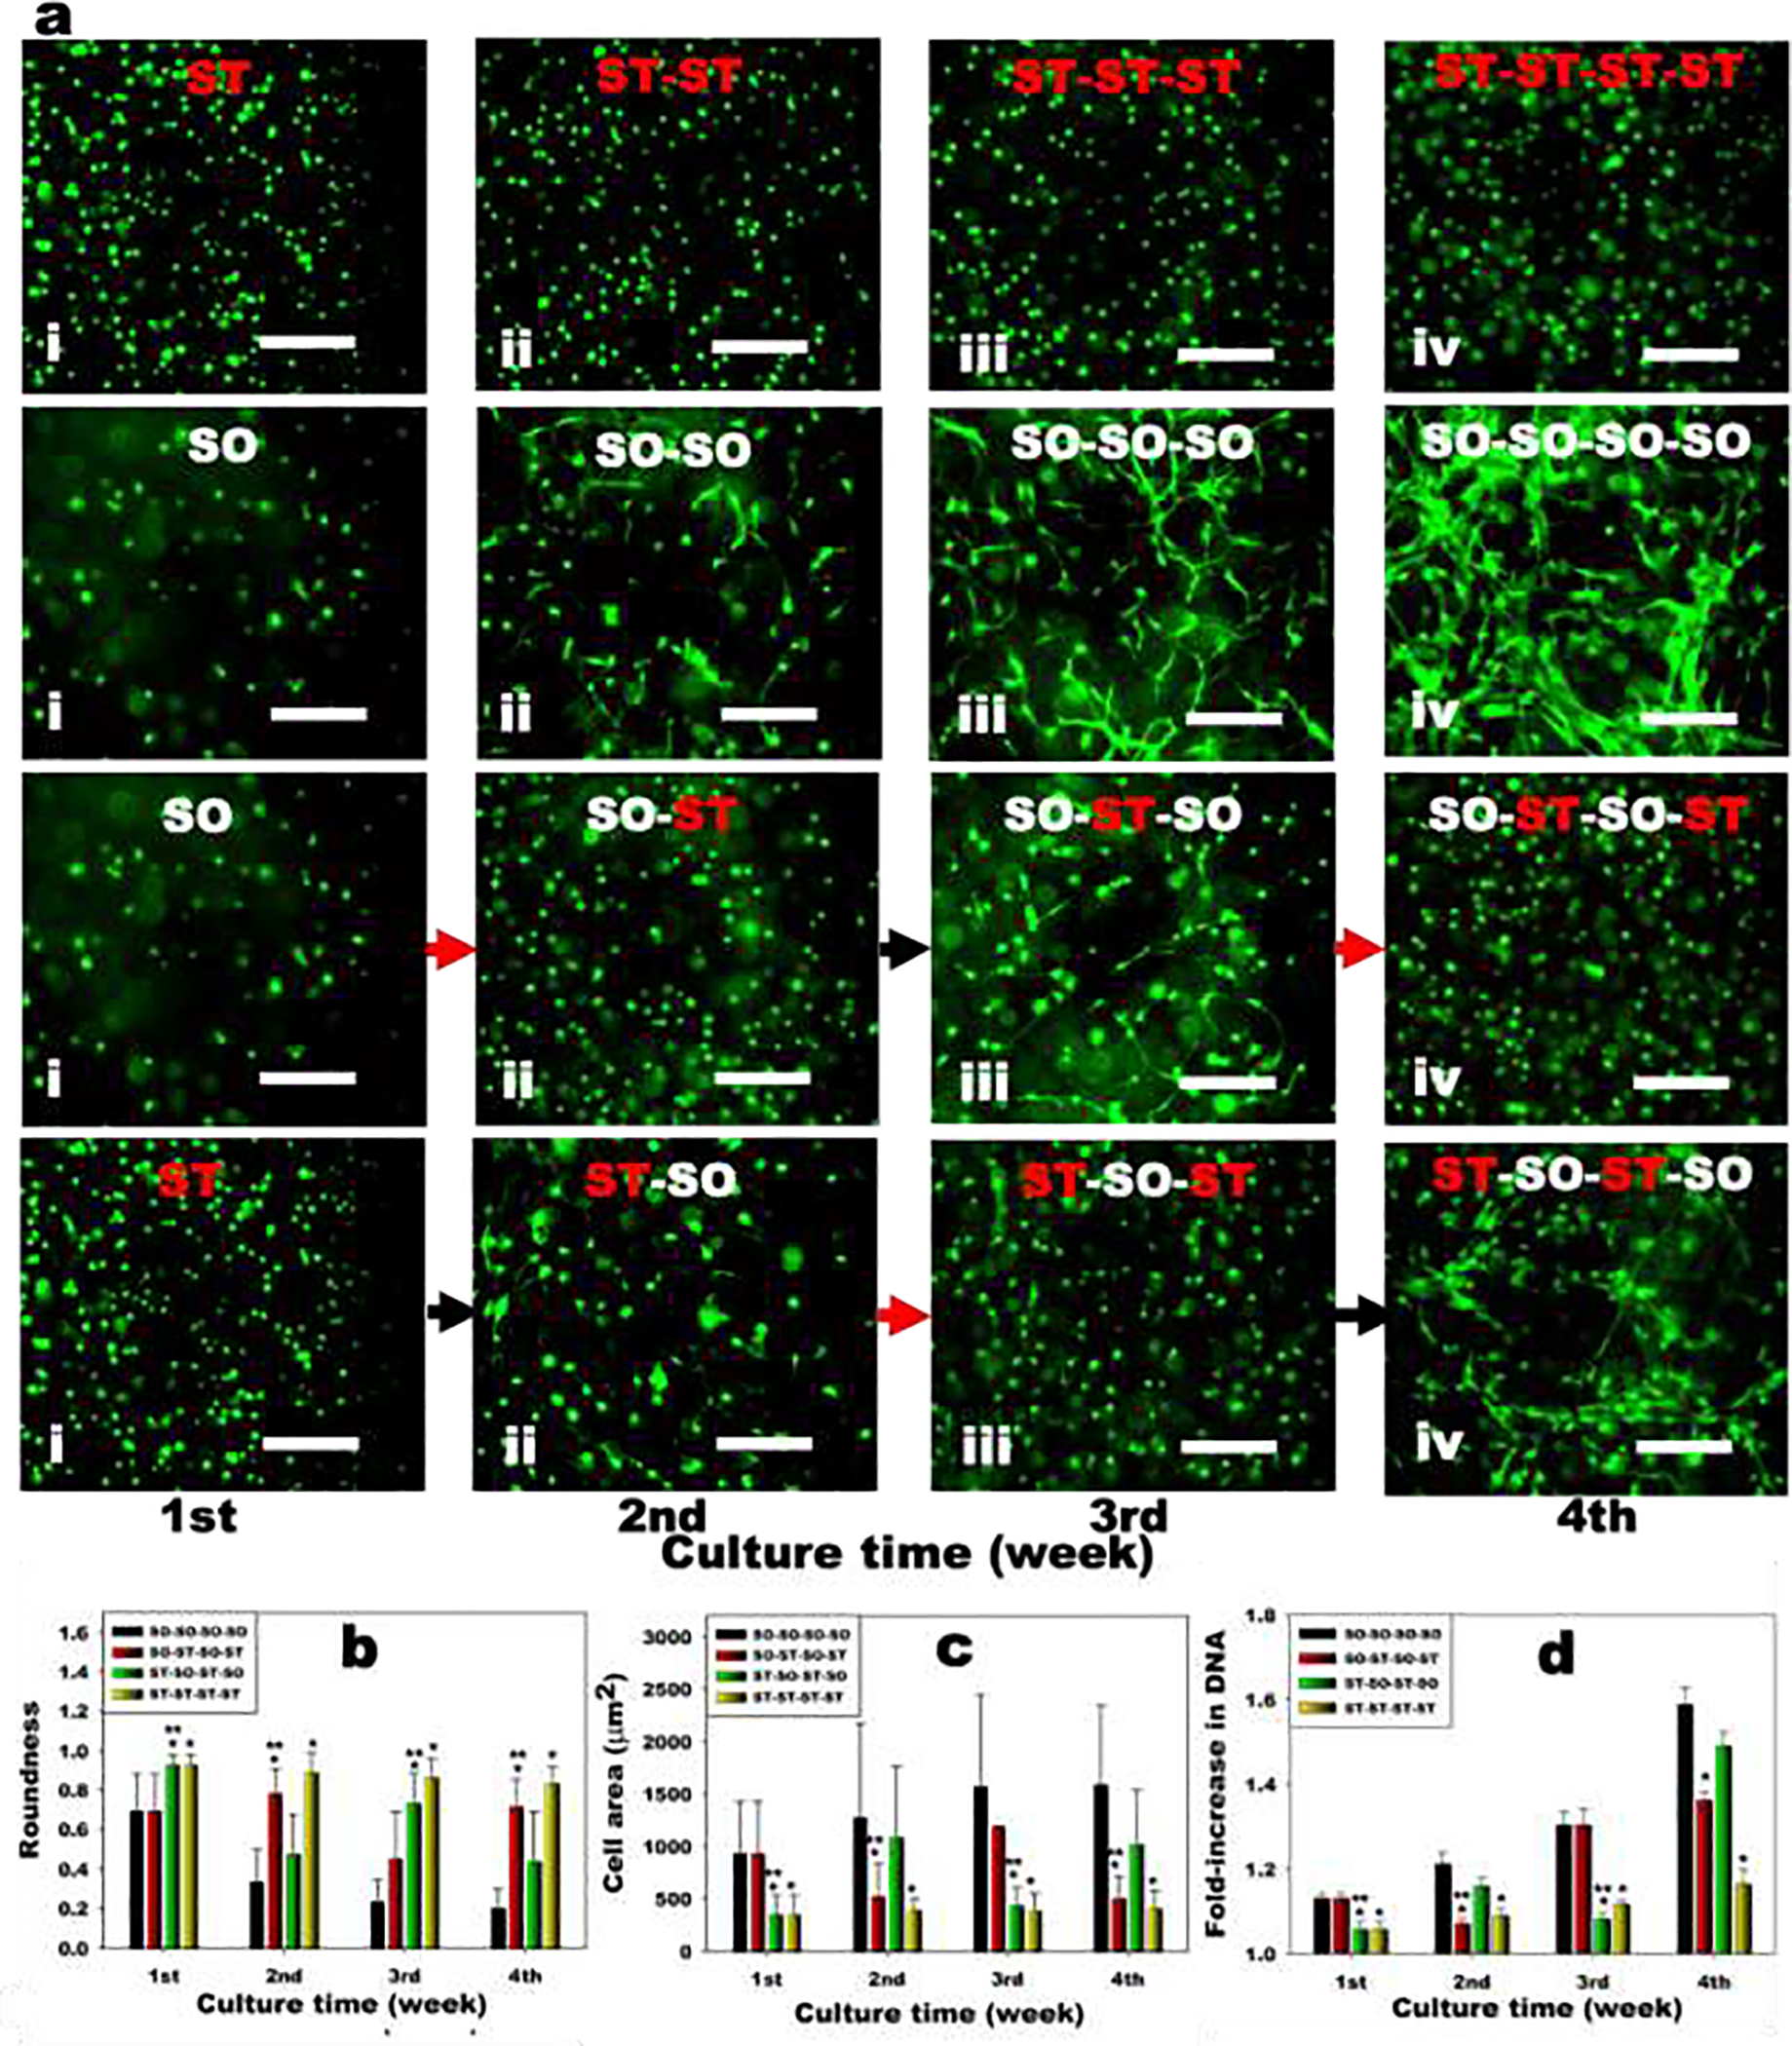
Figure 4.

Encapsulated hMSC response to reversible dynamic hydrogel mechanics in 3D. (a) Representative live (green) and dead (red) photomicrographs of encapsulated hMSCs in the hydrogels for 4 weeks. Red arrows indicate stiffening of hydrogels 1 week prior and black arrows mean softening of hydrogels 1 week prior. The scale bars indicate 100 μm. Quantification of cell (b) roundness (N=20) and (c) area (N=20) within the hydrogels. (d) Quantification of DNA content in hMSC encapsulated hydrogels over time (N=4). Black bars = SO-SO-SO-SO, Red bars = SO-ST-SO-ST, Green bars = ST-SO-ST-SO and Yellow bars = ST-ST-ST-ST. *p<0.05 compared to soft hydrogels (SO) at a specific time point. **p<0.05 compared to soft hydrogels (SO) within a specific group.
