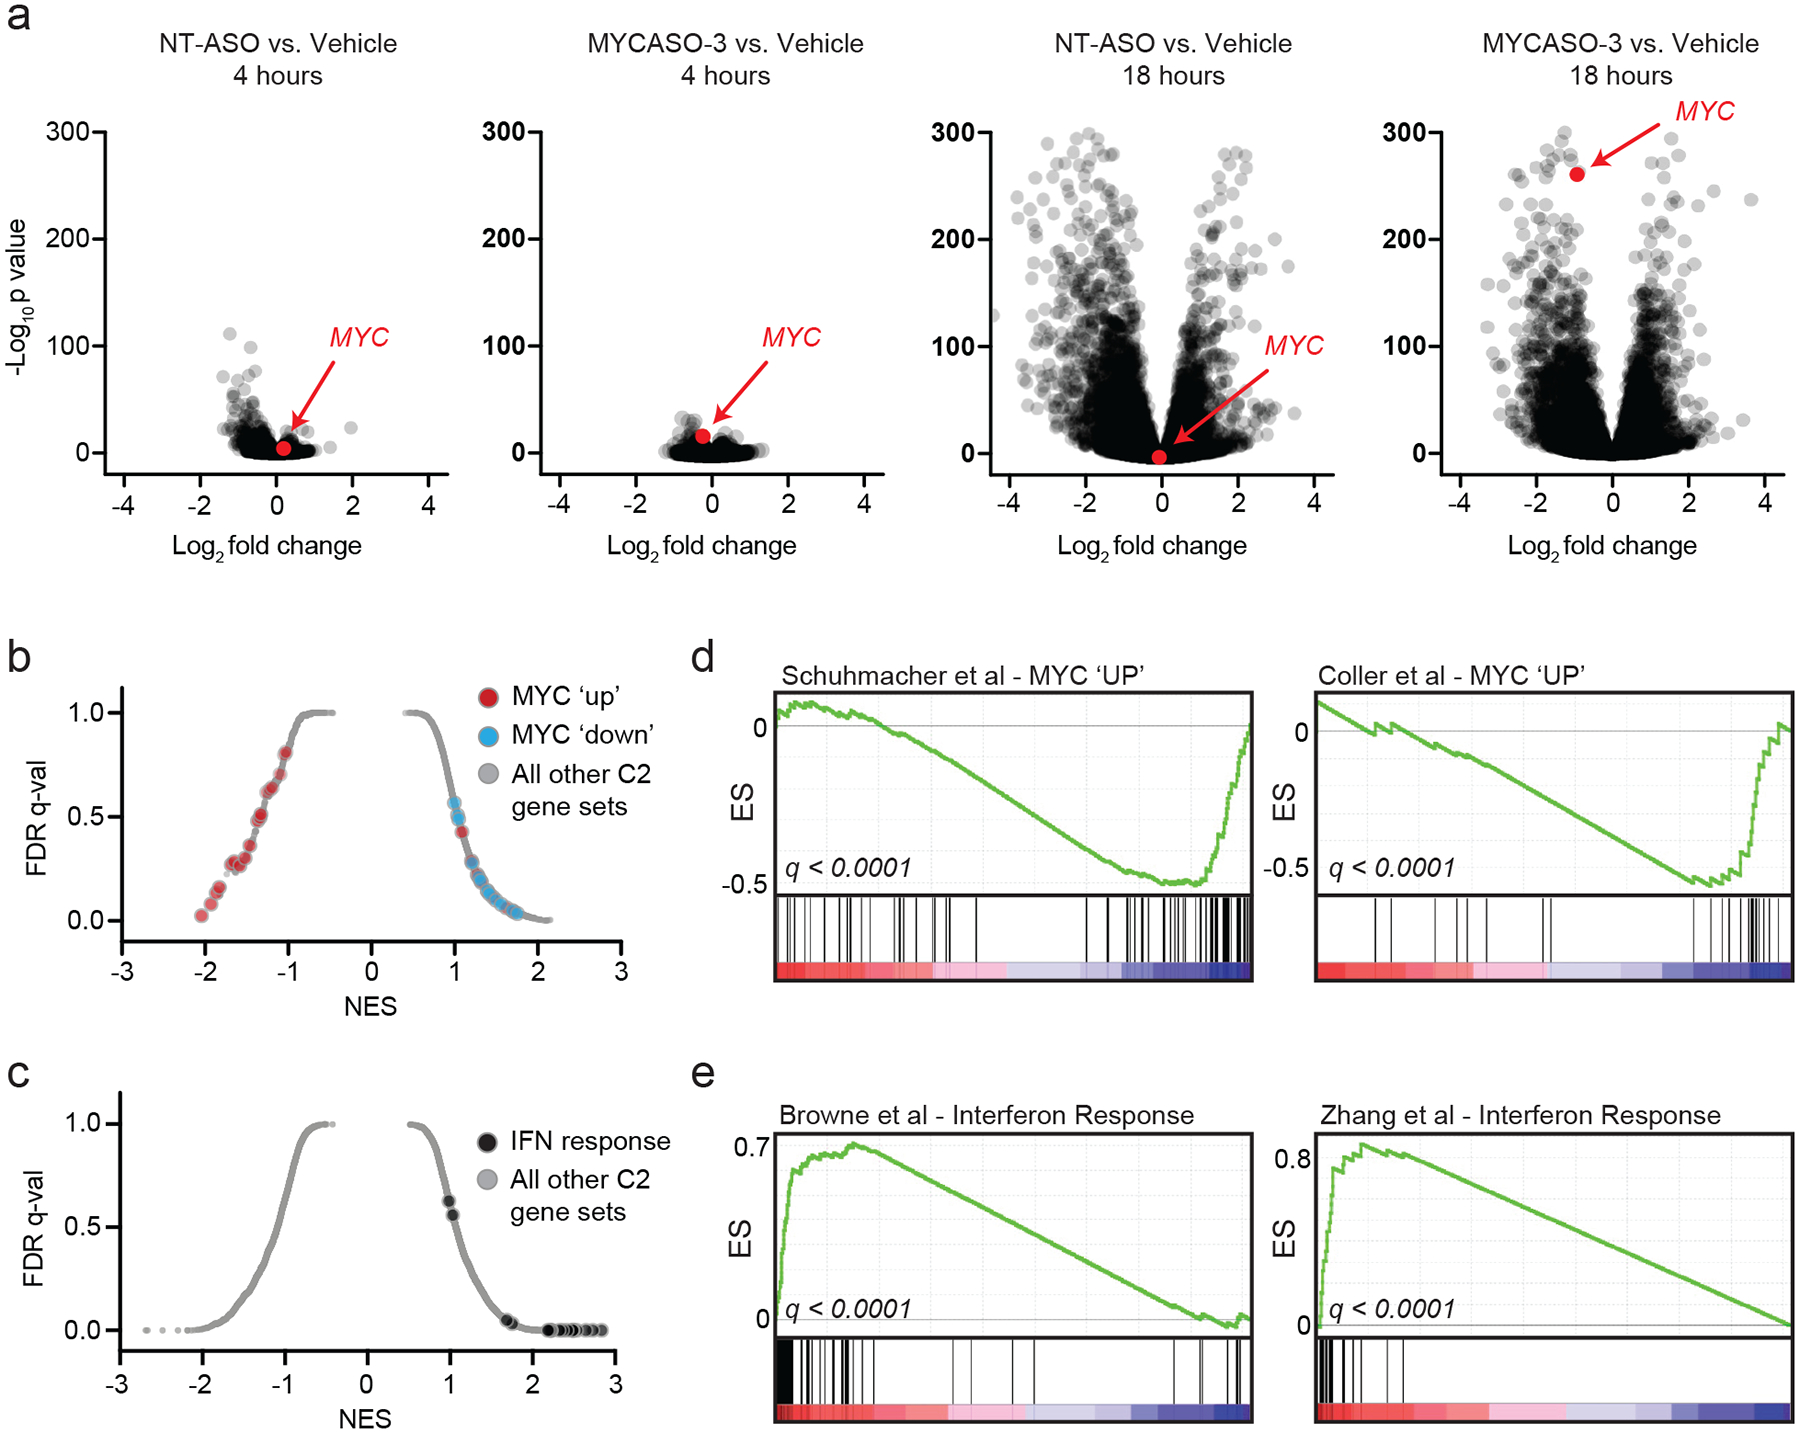
Figure 5: Transcriptomic analysis of MYCASO-3 treated cells.

(a) RNA-sequencing was performed on HeLa cells transfected with NT-ASO or MYCASO-3 (10 nM) using Lipofectamine 2000 as delivery vehicle. Volcano plots of gene expression differences comparing NT-ASO and MYCASO-3 treated cells with vehicle after 4 and 18 hours. (b) Gene set enrichment analysis (GSEA) normalized enrichment scores for MYC-associated gene sets (red and blue) and the total C2 gene sets as part of MSigDB in MYCASO-3 treated cells. Differential expression analysis was performed with DESeq2 as described in Methods. (c) GSEA normalized enrichment scores for interferon (IFN)-associated gene sets and the total C2 gene sets as part of MSigDB in ASO-treated cells (NT-ASO and MYCASO-3 samples). Differential expression analysis was performed with DESeq2 as described in Methods. (d) GSEA signatures for two example gene sets of genes positively regulated by MYC (MYC ‘UP’). (e) GSEA signatures for two example gene sets of the interferon response.
